Hi All,
I have built a report using the free app called - Reports - Charts and Graphs for Jira Dashboard Free by Bloompeek.
Everything looks good except - this report shows my Epic as a Issue (technically it's correct) but I want to report Epics and User stories separately. For example - Epic containing how many user stories/tasks/bugs along with their status.
Please see this attached image:
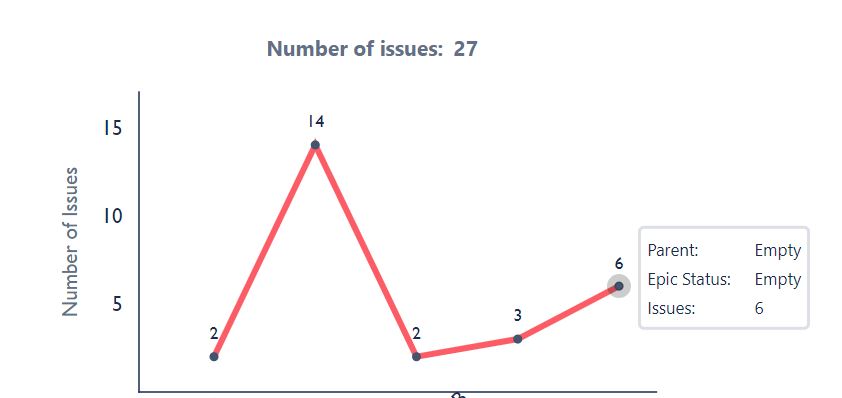
I have:
Issues - 20
Epic - 6 (2 are not visible, since they don't have any user stories)
Bug - 1
I do not want this number 6 to be shown on this report. 6 is the sum of total epics in my current project. How can I remove/hide this metric from the report.
This do not add any value to the report nor it is giving any insight. How can I modify the existing report to be more meaningful and interactive.
Also, let me know if there is any other existing OOB app/widget which I can use for reporting this information.

