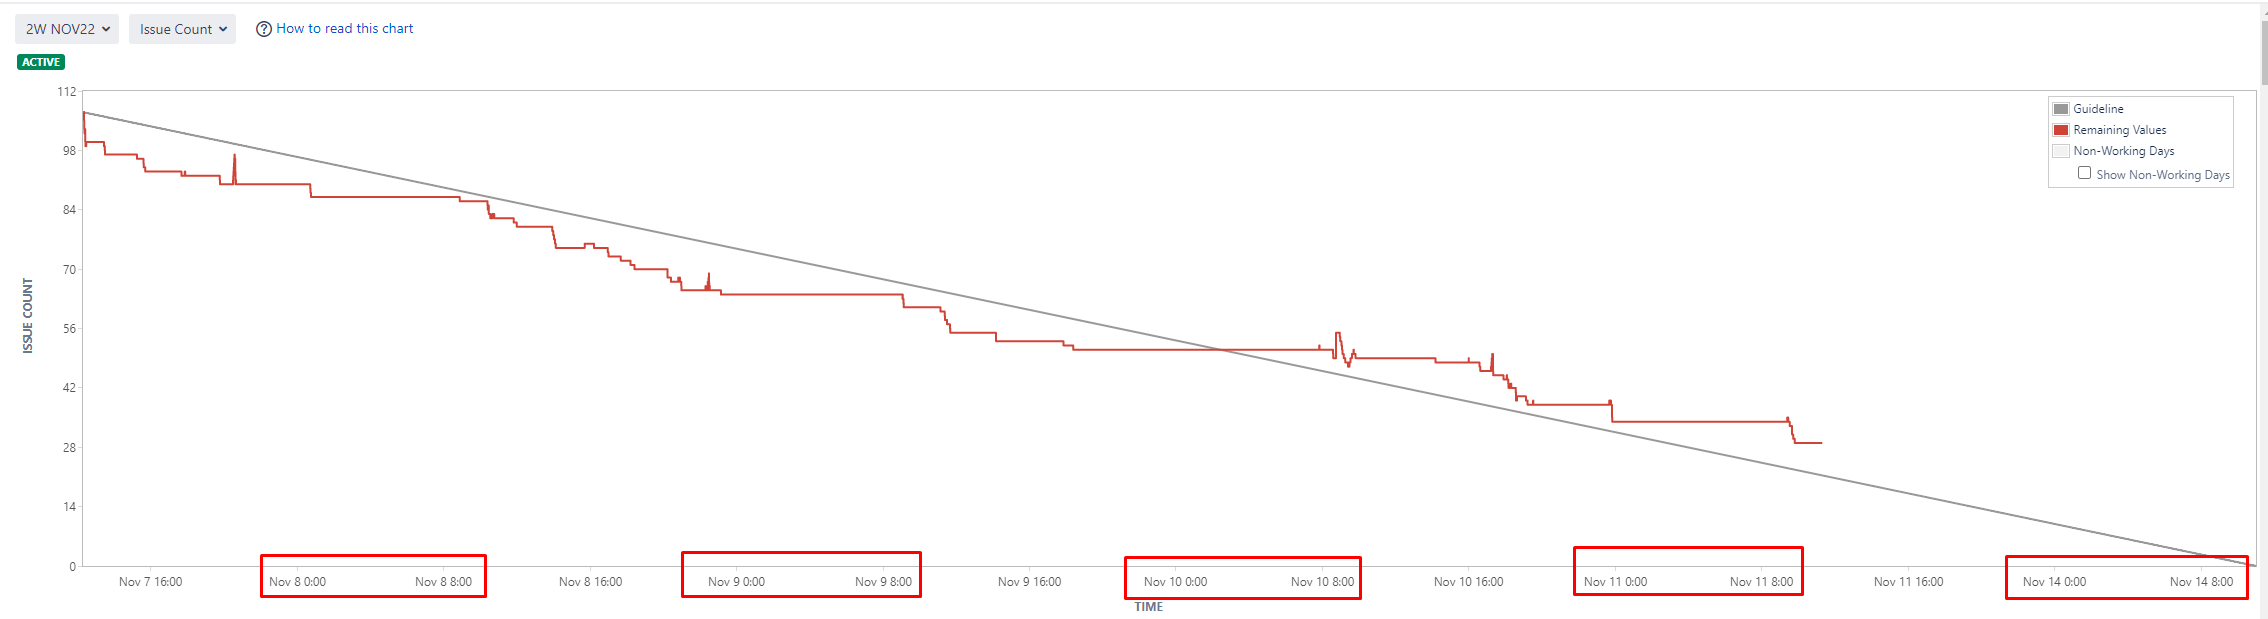
We have a burndown graph for the count of issues that enter or leave the sprint, however in this count it counts the period from 00hrs to 08hs and in this period we don't work and even so the graph keeps dropping the count. My question is how can we customize this graph so that during this period the graph stays in a straight line?