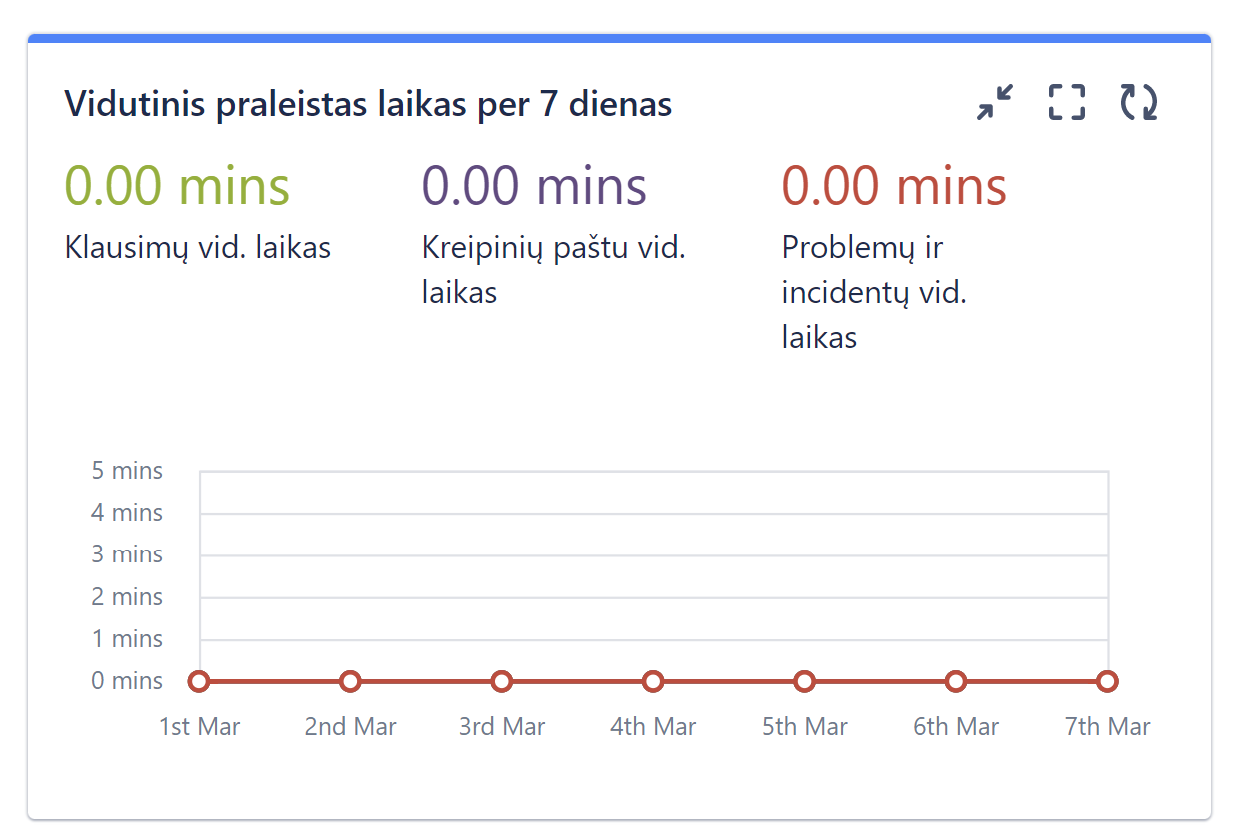
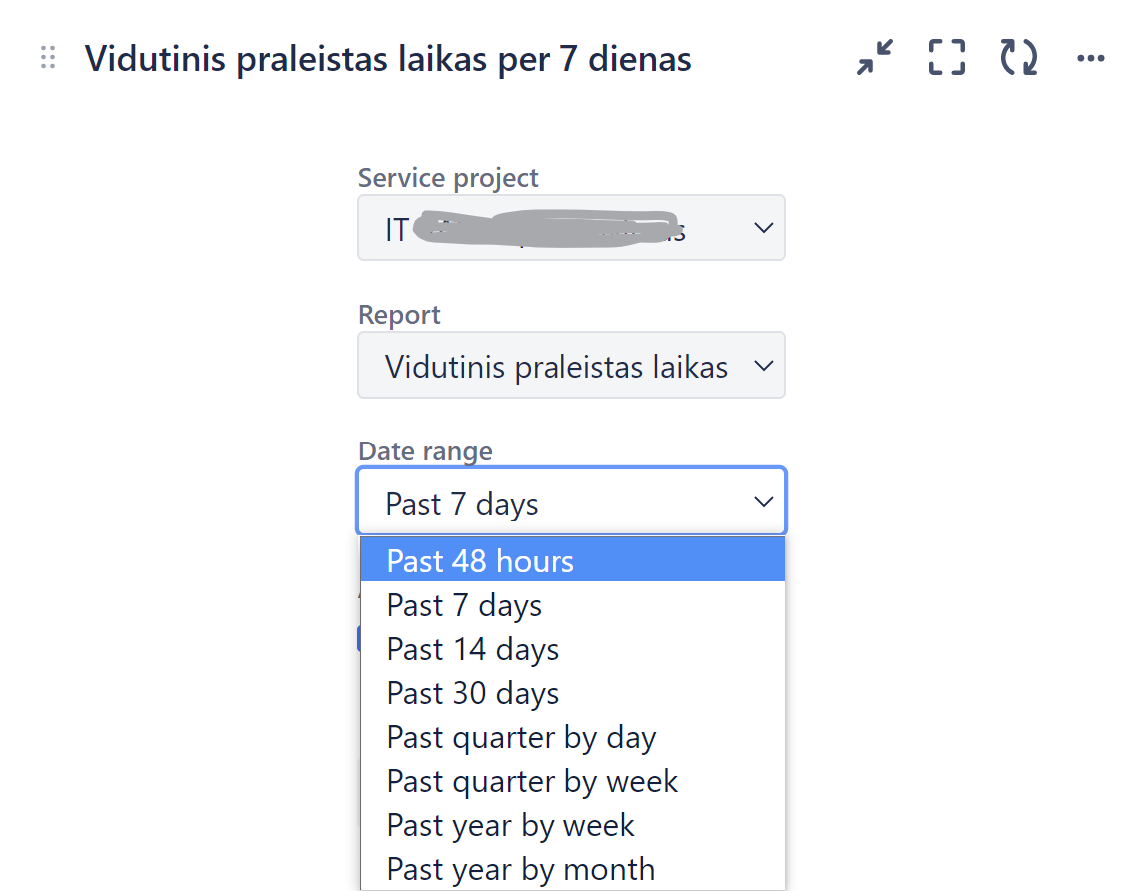
Is it possible to get the average time to resolution statistics of yesterday's service project in the dashboard? The shortest now is 48 hours, but we must have an average of one day because we must follow our KPI day-to-day basis. Yes, we get a lot of requests during the day.
I know it is possible to do these under service project reports to set the custom time range to one day, but it is not very convenient to do every day.
Maybe there is some workaround, some other way?
Disclaimer: currently we are still working with our old help desk and we do not have requests on the Jira service desk yet, but we are preparing for the future.