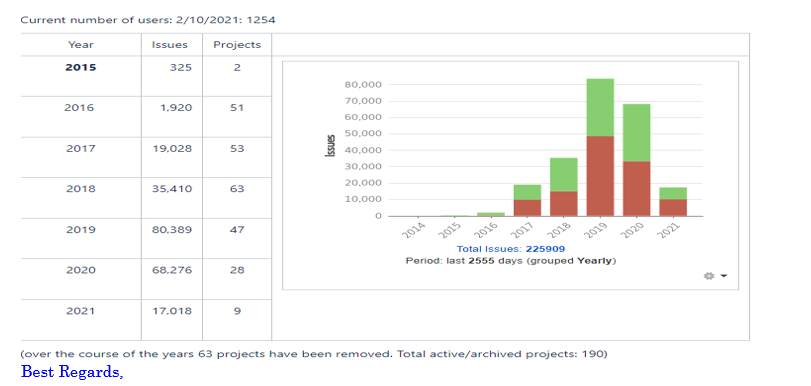
A previous admin created a graph that had all projects: their count by year, with the total number of issues and total projects created. I've been tasked with updating last year's chart and I'm trying to figure out how it was done. Does anyone have any ideas?