Have you discovered dashboards yet? They’ve just landed in iOS and macOS, delivering one glorious overview of your work.
Dashboards have been one of the most-requested features in Jira mobile apps. Why? ‘Cos they’re pretty darn awesome, that’s why. (Create one and take it for a test-drive. Enjoy the juicy awesomeness.)
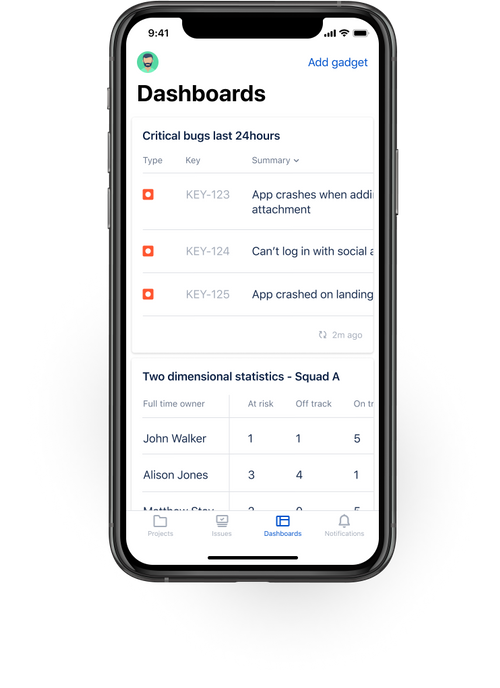
Image: Dashboard on iOS
What’s a dashboard?
Dashboards deliver a streamlined overview of what you’re working on.
System dashboards are available by default; admins can set them up via Jira Cloud for web, and select gadgets. Personal dashboards can be set-up by you (also via web), with your favorite gadgets to track your most important work.
The iOS and macOS apps currently support pie charts, two-dimensional filter statistics, issue statistics, and filter result gadgets.
Missing your favorite gadgets in the app?
Let us know which gadgets you'd love to have in the app by opening the app and going to your account > Send feedback, or by emailing us: jira-cloud-native@atlassian.com 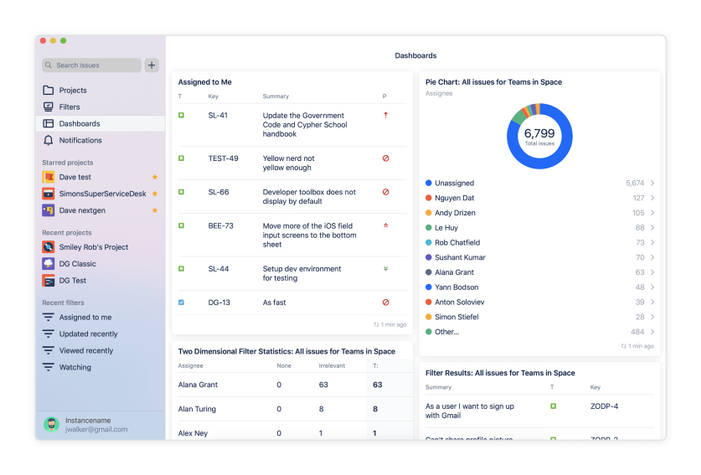
Image: Dashboard on macOS
How do I get a personalized dashboard?
Dashboards can be created and edited via Jira Cloud for web. Simply navigate to your project in a web browser, and select Dashboards in the top navigation bar, then select Create dashboard.
Check out these docs for more information about creating and editing dashboards, as well as searching for existing dashboards, via Jira Cloud for web.
Already personalized a dashing dashboard? (Sorry, had to do it.) Chuck a screenshot in the comment section below!


![Photo of YUASA Yuya[Ricksoft]](https://avatar-management--avatars.us-west-2.prod.public.atl-paas.net/initials/YY-0.png)
