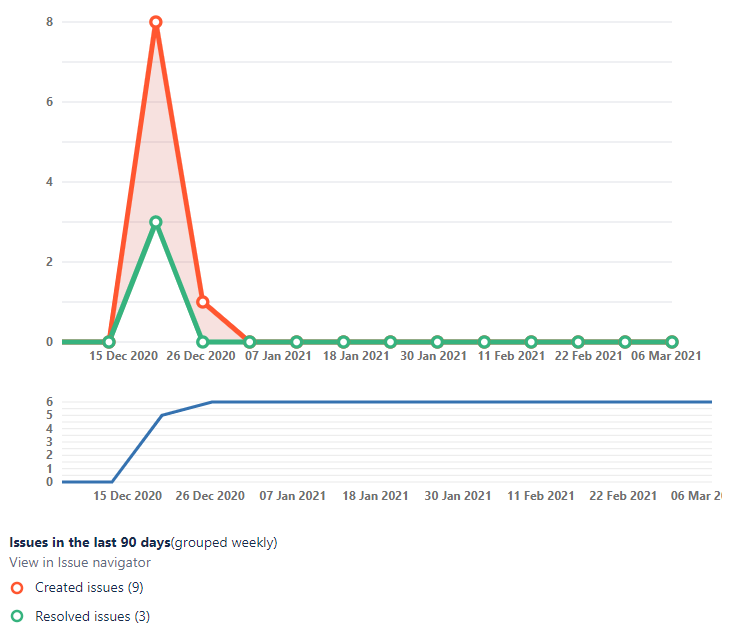
So we are using Jira Service Desk or Service Management and it already has great built in reporting that shows created vs resolved each day. However, I also would like to show how many tickets were in the Queue at the end of the day. Then I can plot it against the created vs resolved and see what type of trends we are getting.
I have looked and tried everything but it won't show the trend of tickets left in Queue each day, and if you resolved it eventually 4 days later it gets removed from any JQL that I have gotten to come close.