On every issue, the SLA area displays to following: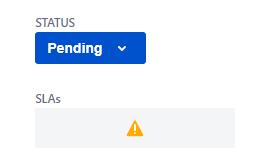
This is a new JIRA/JSD installation in the Cloud, with a JIRA Server import into the Cloud (from original 4.1.1 Server data that was upgraded in steps before the Cloud import).
The SLA setups (just Time to First Response and Time to Resolution at this point, modified from the template defaults) do not show any errors. The project was created from the General Service Desk template.
Nor does the Time to Resolution column that I have added to the Queue display show any data - it is just blank.

