I have a wallboard with a chart that shows a Time To First Response widget.
The widget looks like this for a 30 day period:
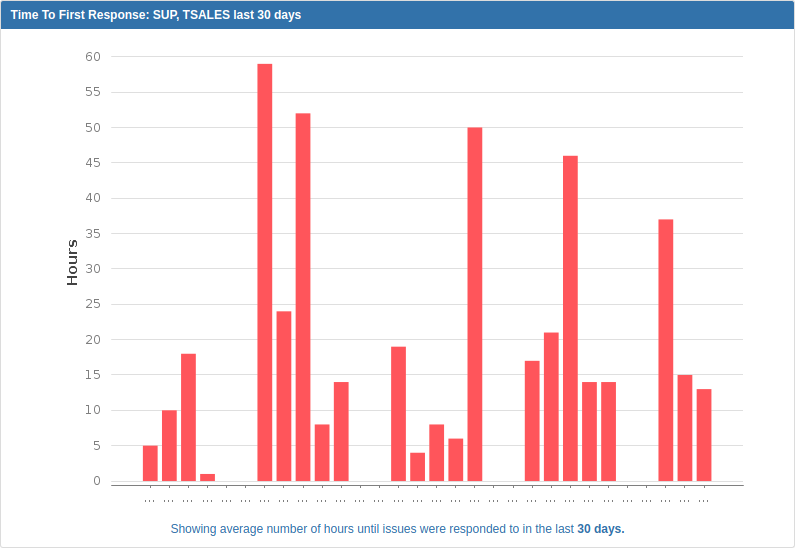
Great!
When I configure the same widget for a 300 day period, then the chart looks like this:
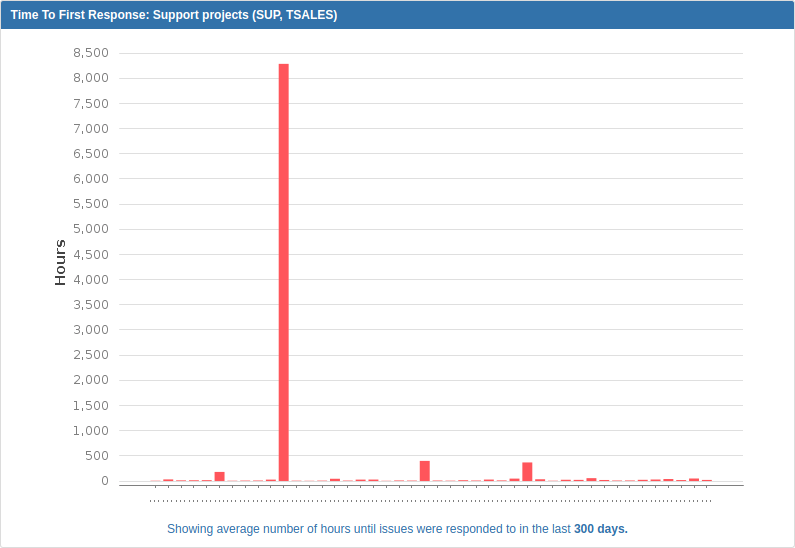
Not so great... :-(
What happened: in week 28 of 2018 we ran an Automation for Jira rule that deleted attachments from closed issues after 30 days of inactivity, and added a comment to explain why they were deleted (because of GDPR compliance).
A typical JQL for one week, represented by one bar in the chart, would be
project in (SUP, TSALES) AND cf[10900] >= 2018-07-01 AND cf[10900] <= "2018-07-07 23:59"
Now, the problem most likely is that not all issues already had a value in the field cf[10900], but did already have comments from before that field was added. When the Automation rule ran, cf[10900] was suddenly filled in for these issues, with a value of the comment added by the Automation rule, not with the date of the actual first comment. That's how the spike got in there, and it makes the chart rather useless.
To fix this, I would have to:
- if the value of cf[10900] is not empty OR
- if the value of cf[10900] is empty AND
- the issue has comments that are not by the reporter
- change the value of cf[10900] to the date of the first comment that is not by the reporter
How do I do that? I suppose I need to update it directly in the database? I do have database access if needed.
EDIT: additional GOTCHA, I updated the above description
https://ecosystem.atlassian.net/wiki/spaces/JCHART/pages/329274396/JIRA+Charting+Plugin+-+Custom+Fields
- First Response Date - required to be installed, this custom field indexes the date of the first comment that is not by the reporter (for fast querying during charting) but also allows you to add this date into any filter or search.
