Hi all,
In this article we will talk about real-time monitoring of Atlassian applications.
But first, let us define what monitoring is and why it is important to monitor Atlassian applications.
Monitoring is used for measuring performance and availability of software applications. Another words, it visualizes the current state of an application in the real-time mode.
When is it useful to monitor Atlassian applications?
Here are a couple of examples:
- You want to know how an Atlassian application update or a plugin update influences performance.
- You want to know hardware or memory parameters during certain conditions or certain time intervals. For example, how the number of users or day time influences performance.
- You want to monitor how active your users are. For example, how many issues are created within a day or an hour.
- You want to be notified if the license for an Atlassian application or a plugin is about to expire.
- You want to know how much disk space is taken by attachments.
It is also important not only to be able to view information about the current state of an application, but also receive notifications if something went wrong.
Solution architecture
Prometheus can monitor thousands of services. Prometheus collects metrics as frequent as you defined, usting the pull-model, and stores collected metrics in the database. Also there is the Alert manager, which can send notifications to different channels, if an event has been triggered.
Prometheus exporter is an agent, which collects metrics from entities (a whole server or an application). Prometheus has rich capabilities for extending, that is why there are exporters for almost all popular applications.
[ jira | confluence | bitbucket | bamboo ]_exporter works the following way:
- collects information from the database of an Atlassian application;
- collects information from Java API;
- intercepts HTTP requests and collects information based on the requests;
- collects JMX metrics.
You can find an example of Prometheus/Grafana installation in Docker here. This example was kindly provided by Stefan Prodan.
Exporter installation and setup
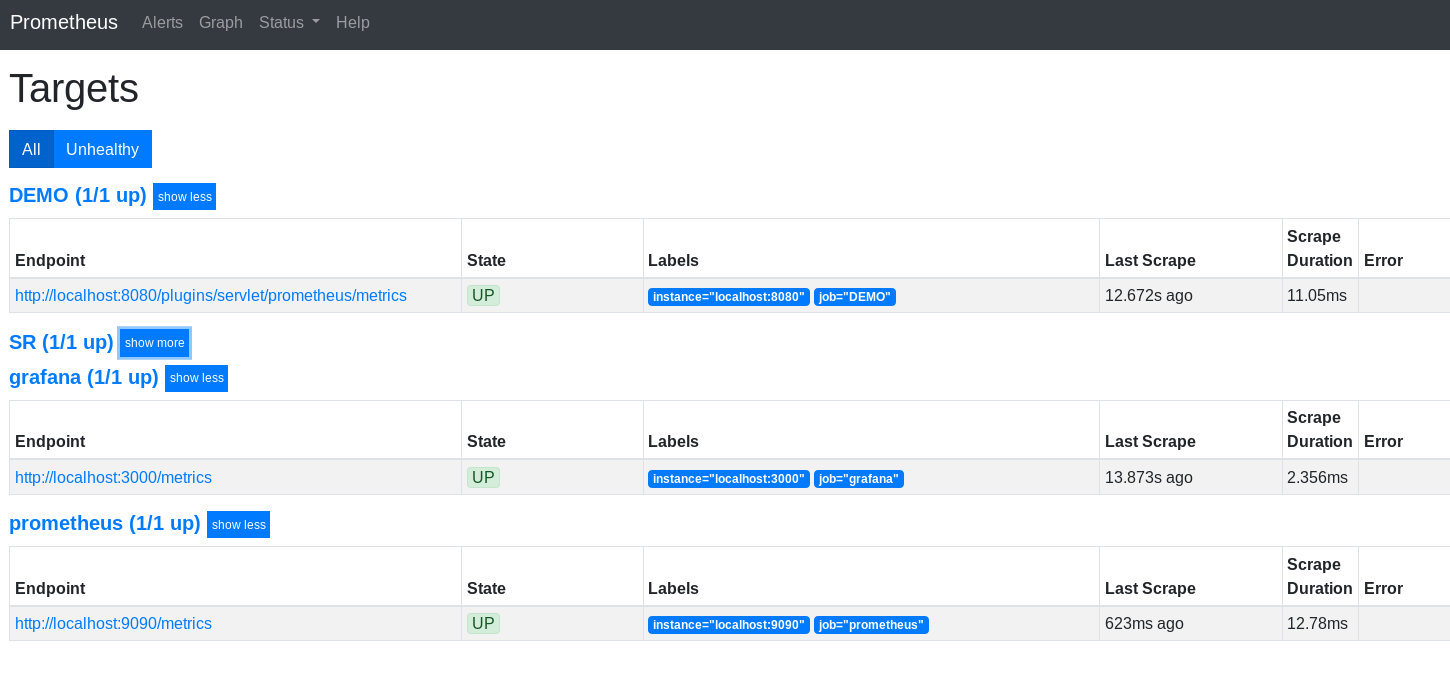
First, you need to install the plugin for your Atlassian Application. You can find all plugins here. When the plugin has been installed, you can receive metrics by baseUrl/plugins/servlet/prometheus/metrics url.
You also can set up security keys.
Then you should add the reference to the metric collection servlet to the prometheus.yml. For example, for Jira it would look like this:
- job_name: 'jira'
  scheme: https # change to http if don't you have https
  metrics_path: '/jira/plugins/servlet/prometheus/metrics'
  static_configs:
  - targets: ['myhost:2990'] # Jira host and port you serve
Installation and setup is finished. You can collect metrics.
Metrics
You can find the whole list of metrics in the documentation for the plugins: Jira, Confluence, Bitbucket, Bamboo.
Query examples:
- Uptime:
jvm_uptime_gauge{<span>job</span>=<span>"jira"</span>} - Server response time:
(<span>sum</span>(<span>rate</span>(<span>jira_request_duration_on_path_sum</span>[<span>1</span>m])) by (<span>path</span>)) / (<span>sum</span>(<span>rate</span>(<span>jira_request_duration_on_path_count</span>[<span>1</span>m])) by (<span>path</span>))
- Total number of issues:
jir<span>a_total</span>_issues_gauge
- Dashboard view number:
sum(<span>increase</span>(<span>jira_dashboard_view_count</span>[<span>1</span>h]))
More information about queries you can find here.
Grafana dashboards
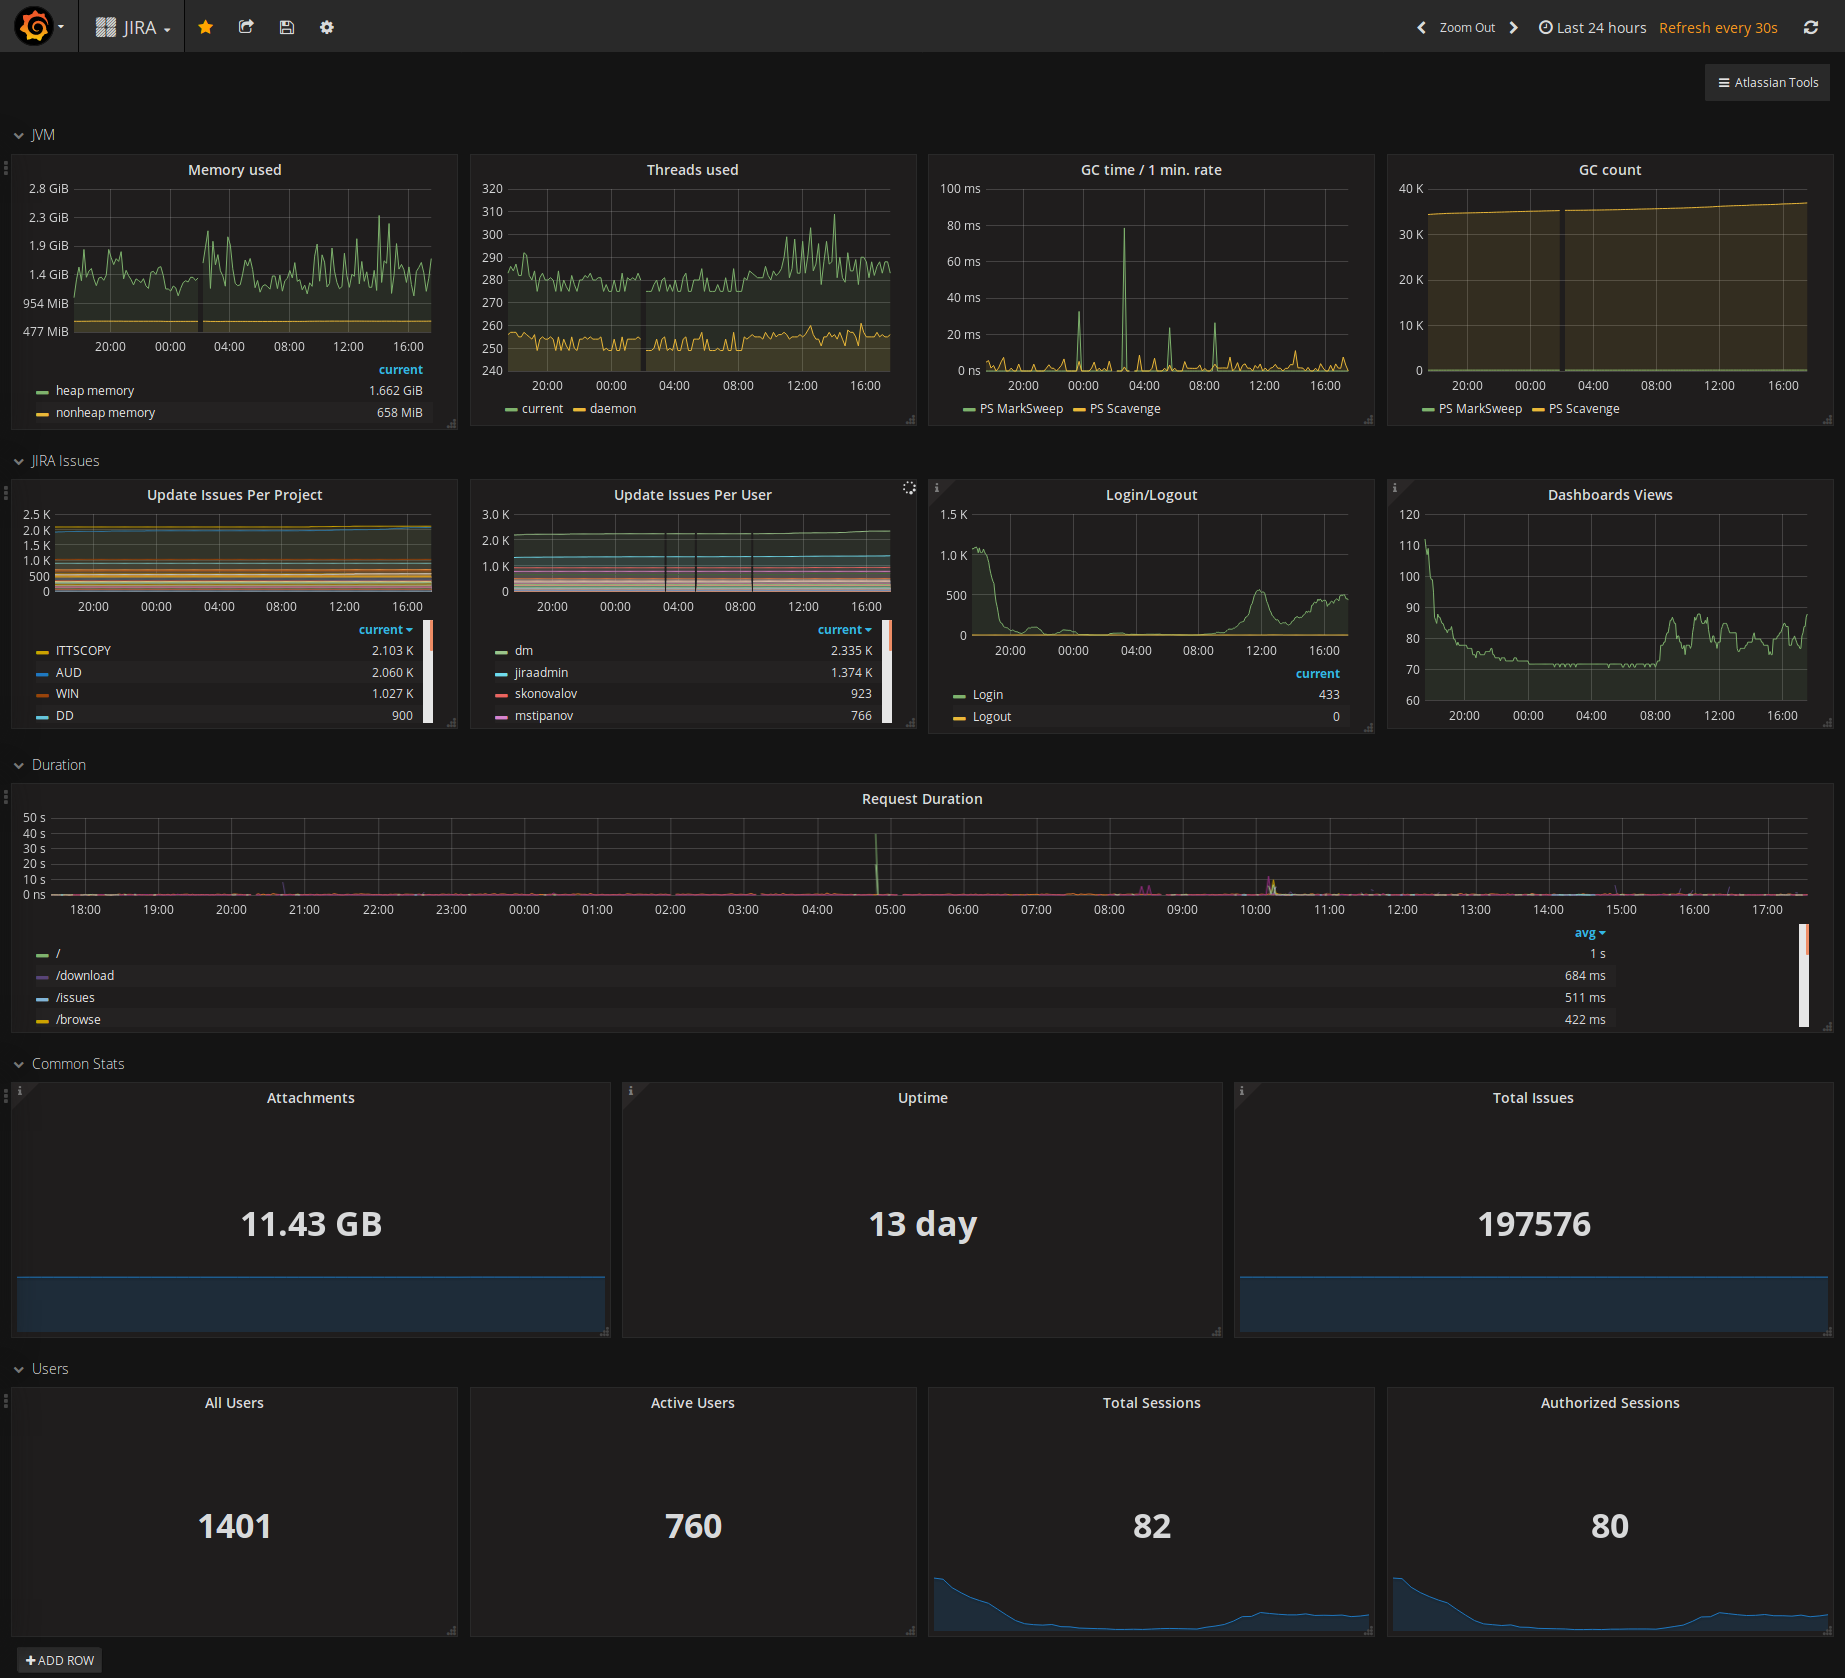
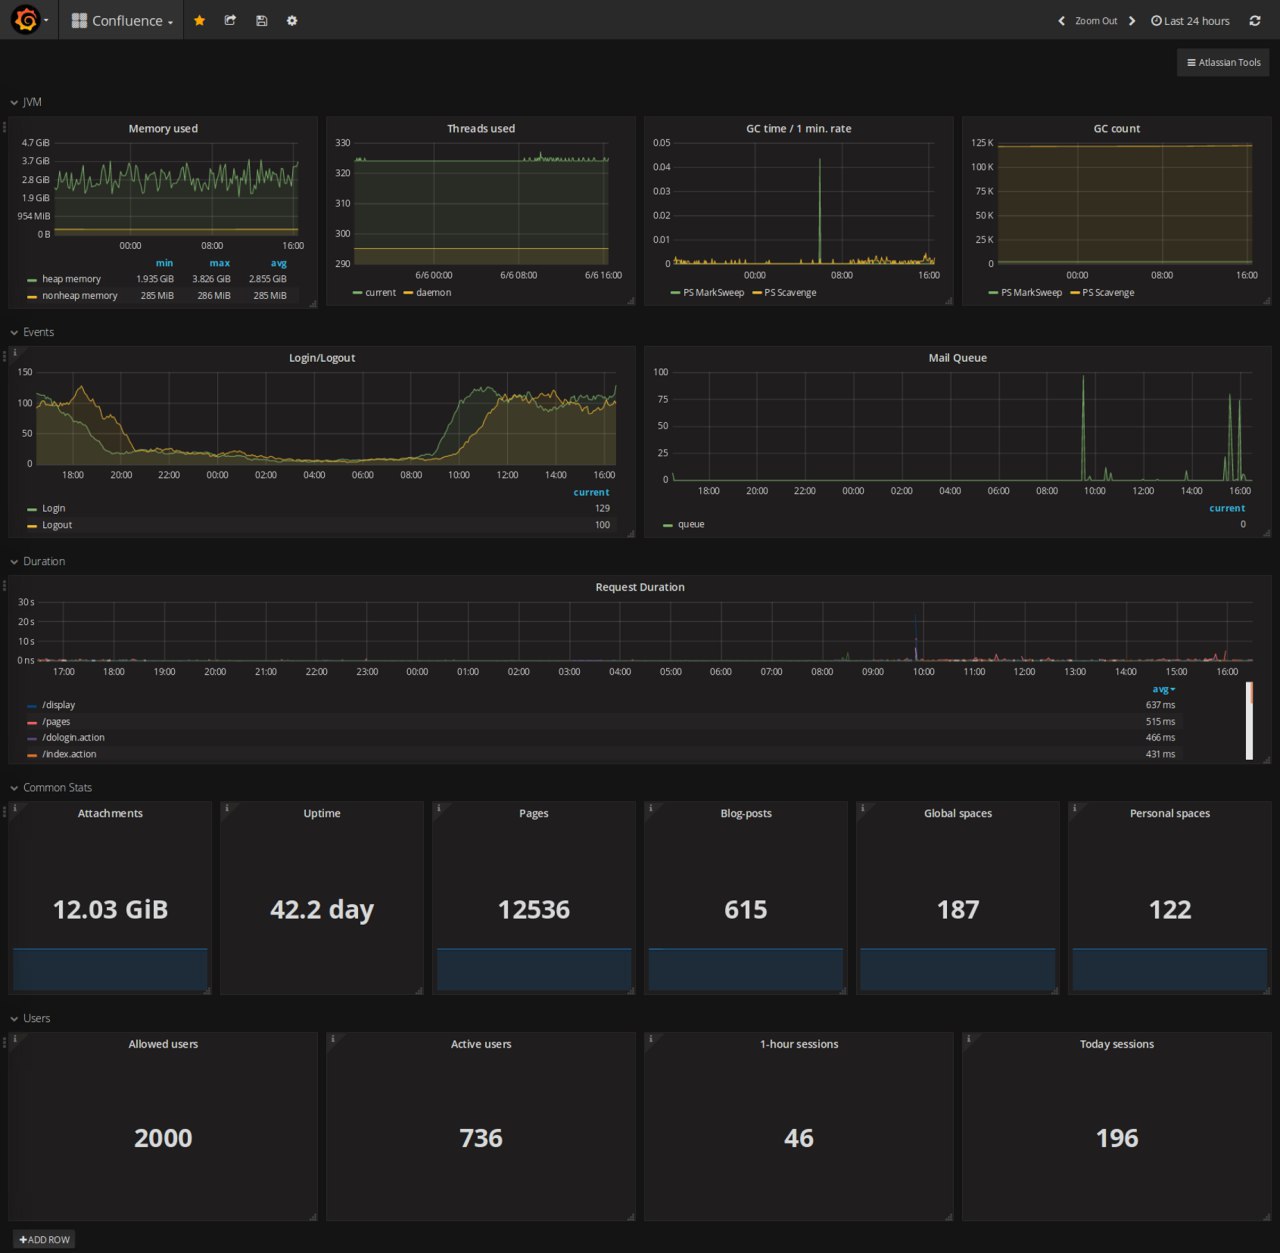
You can use Grafana to visualize metrics stored in Prometheus. There are a couple of example dashboards in the official site.
You can find a dashboard for Jira here.
Here is a dashboard for Confluence:
Features
There are plans to let users define their own metircs, using the Groovy language. You will be able to collect your custom metrics not only from the Atlassian applications but also from other plugins. Also there will be metrics collected from Jira Service Desk.
All Prometheus exporters for Atlassian applications are open source and continuously gaining new features.
If you have ideas what features should be included in the plugins, kindly create tickets (Jira, Confluence, Bitbucket, Bamboo) or open pull requests.
Conclusion
If your Atlassian instances are large and you need to ensure their stability, then you need to use monitoring. It is up to you to decide how to do it. Prometheus is one of the possible solutions to accomplish this task.
Thank you!