When I deselect the 'Done' column in the cumulative flow diagram, negative values appear.
The reason I'm deselecting the column is that the large number of issues that have been 'Done' ruin the scaling of the other columns on the Y axis, so the diagram doesn't convey any useful information.
Here is the overview, showing the negative values:
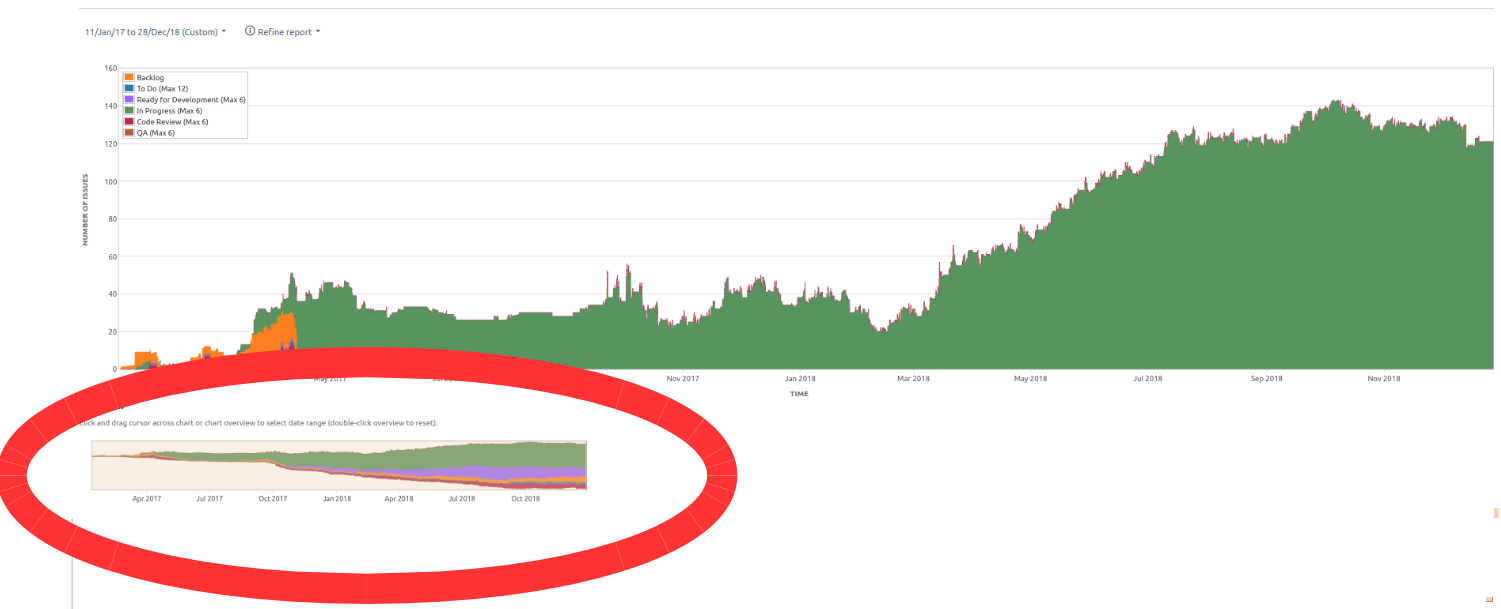
I have tried extensively to reproduce this weird behaviour intentionally using new tickets with a 'test' label and then applying a quick filter to the CFD:
- I tried moving tickets unconventionally through the workflow
- I tried moving tickets part way through the workflow in other projects, before only then moving them to this project
- I tried closing, reopening, and restarting tickets in the weirdest ways I could imagine
With all of this, the diagram successfully read the status history and displayed it correctly without any negative values - so I have not been able to establish the root cause of these negative values.
Please help me sort this so that the data becomes useful
Note: The number of issues in each column as stated by the diagram is in the hundreds, whereas the number of issues actually in each column is less than 20 - I'm not sure if this is a separate or related issue...

