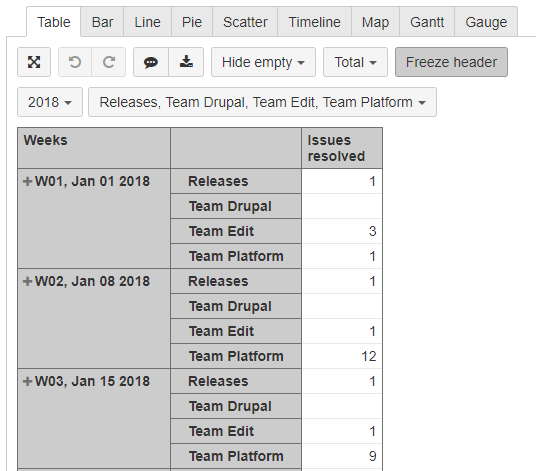
Hi! I'm new to using EazyBI. I am looking to create a report that shows tickets that have the component "Releases" and a subset of other components - Team Drupal, Team Edit, and Team Platform, see image below.
Right now it shows each of the components separately but I'd like to be able to drill down releases show how many tickets are Releases + Team Drupal, Team Edit, and Team Platform.
I'd like to ideally create a bar chart that can stack the 3 components.
I've tried to create a calculated member formula but it doesn't seem to work. Anyone have any advise?


