The challenge is: combine tasks and projects timeline as far as simple
This is how I realized it:
Macro „Chart from table“, type Gantt, with embedded tasks (table) for each project:
 In my project overview I use “chart from table” as well, here with the “task report”, filtered with macro “table filter” by iconfilter =
Result: I get a timeline over all open project milestones:
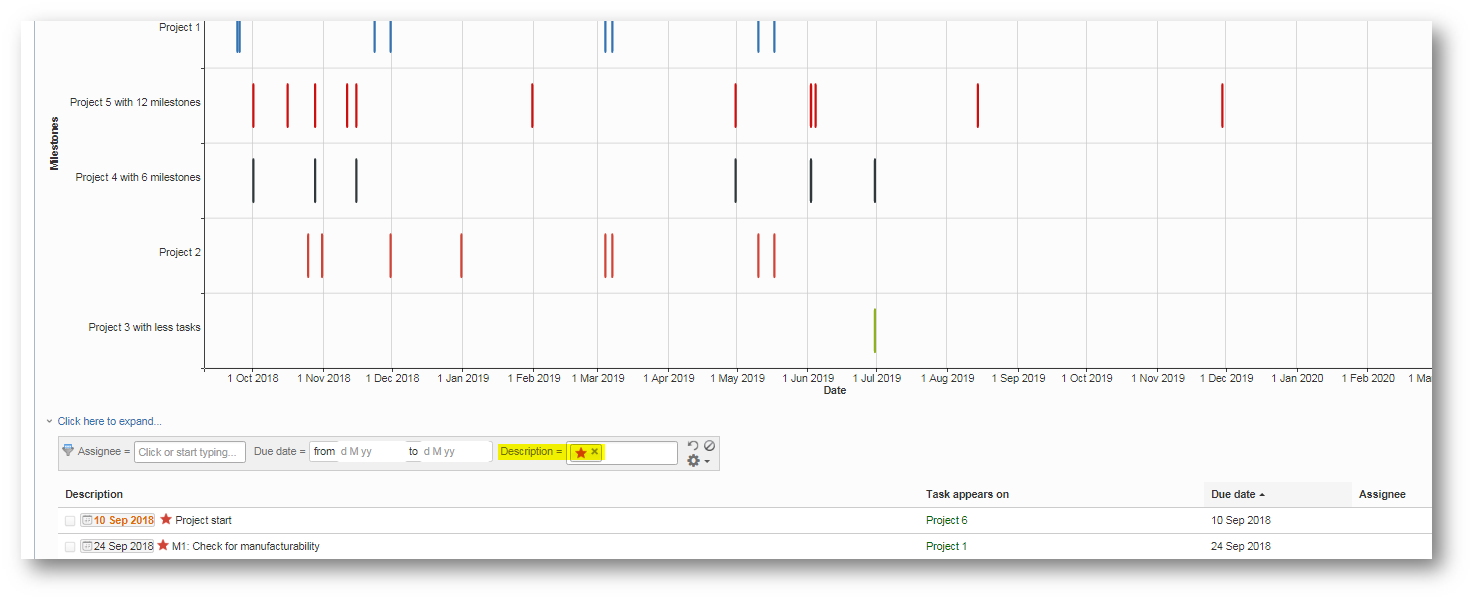
So far so good! A brilliant visualization! I thought, my job was done, but....
Problem is: I need to change start and end date of one task in a project. To keep my project (and overview) timeline up-to-date, I manually have to change all dates in every following task of this project! Of course, there is no relation between one and n following tasks
Has anybody got an idea about how to solve this? Are there any add-ons which might fit my needs?
Thank you in advance!
Steffi

