Hello,
I'm really new to Jira Service Desk and trying to find my way around.
My goal is to see list of tickets opened during given period, let's say, previous week. Problem is that when I select this, I get a graph and below that - list of days in period with number of incidents opened in each day. When I click on day, I get list of incidents. Question - how do I, hm, combine these, so I get full list of tickets opened with weekly graph? For example, like this: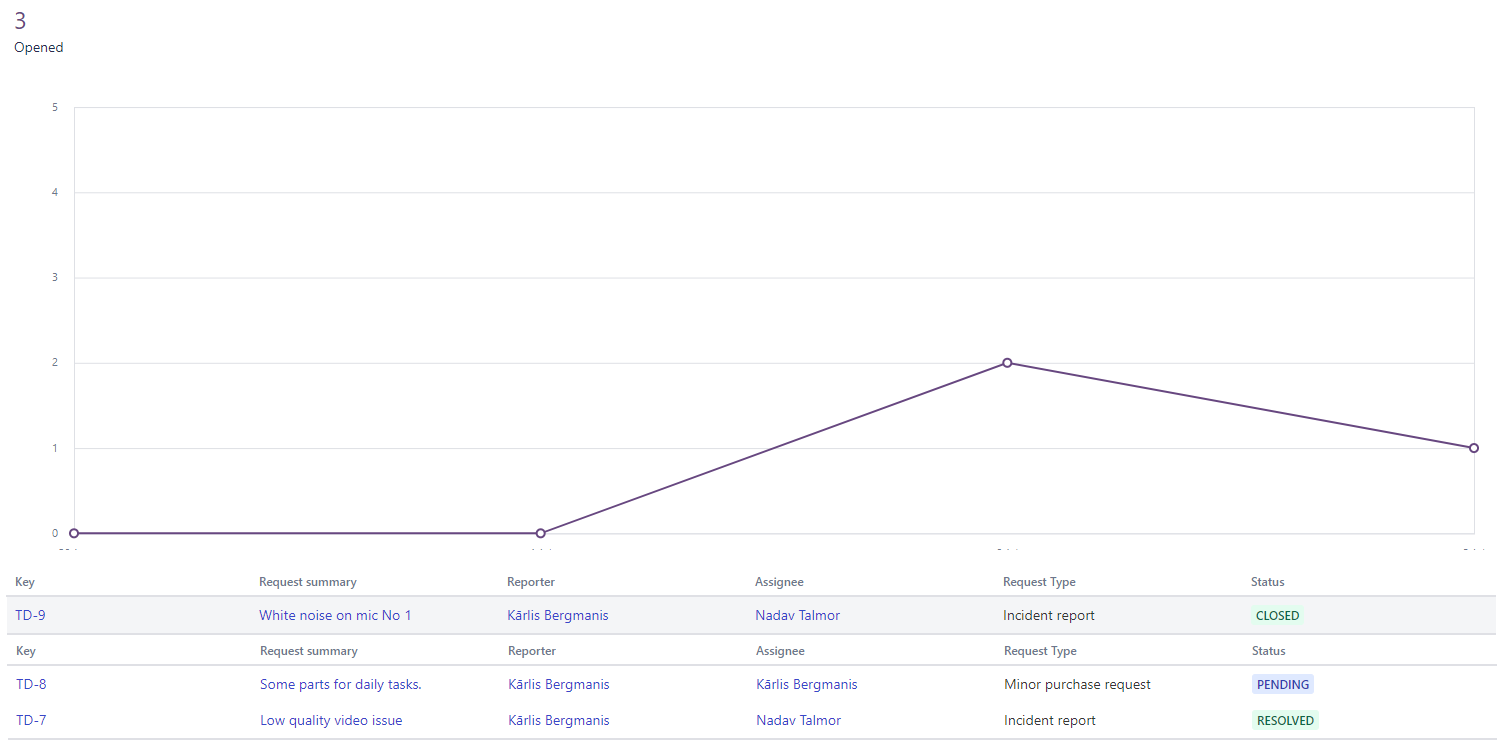
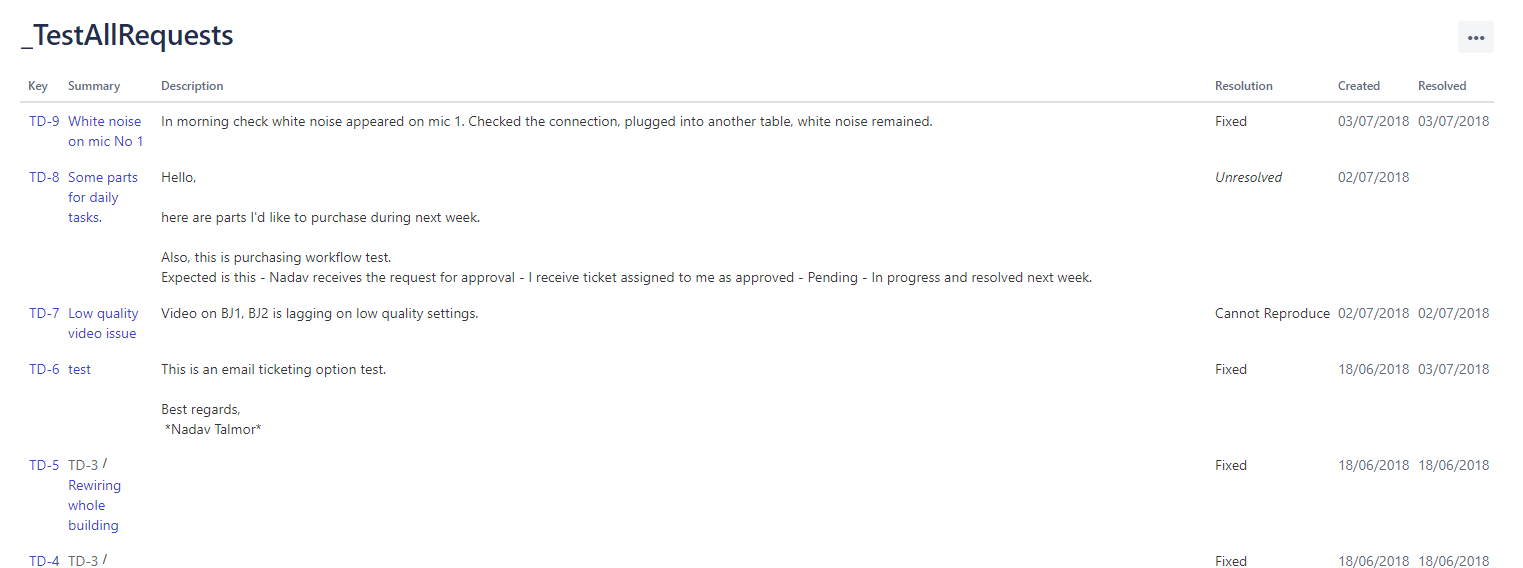
Also, unsure if that still falls within this, but how do I edit fields that are shown here (and thus get exported) - for example, I don't care to see Reporter, but would like to see Description or solution there.
If there is comprehensive source on this topic, please point me in that direction and I'll try to figure it out. Links that I have found so far are quite basic unfortunately.
Updated: As I set this aside and moved to my next point of interest, I found a way to do this in Queue - so is there a way to recreate this view/outlook in Reports? To get overview I could use this Queue, but if I eventually want to automate weekly/monthly reports and get them in csv, they have to be reports.
Truly desired result: