On 6/20 we hit our thread max which caused the environment to go down. An Atlassian support rep recommended increasing the max threads to 120. This seemed to be a band-aid because we are approaching max again.
Error in logs:
20-Jun-2018 15:46:30.024 WARNING [ContainerBackgroundProcessor[StandardEngine[Standalone]]] org.apache.catalina.valves.StuckThreadDetectionValve.notifyStuckThreadDetected Thread "http-nio-8090-exec-29" (id=23022) has been active for 185,298 milliseconds (since 6/20/18 3:43 PM) to serve the same request for https://confluence.ulinedm.com/json/startheartbeatactivity.action and may be stuck (configured threshold for this StuckThreadDetectionValve is 60 seconds). There is/are 7 thread(s) in total that are monitored by this Valve and may be stuck. java.lang.Throwable
	at java.lang.Object.wait(Native Method)
	at com.mchange.v2.resourcepool.BasicResourcePool.awaitAvailable(BasicResourcePool.java:1465)
	at com.mchange.v2.resourcepool.BasicResourcePool.prelimCheckoutResource(BasicResourcePool.java:644)
	at com.mchange.v2.resourcepool.BasicResourcePool.checkoutResource(BasicResourcePool.java:554)
	at com.mchange.v2.c3p0.impl.C3P0PooledConnectionPool.checkoutAndMarkConnectionInUse(C3P0PooledConnectionPool.java:758)
	at com.mchange.v2.c3p0.impl.C3P0PooledConnectionPool.checkoutPooledConnection(C3P0PooledConnectionPool.java:685)
The applied fix:
1) Open the Confluence.cfg.xml file in the data directory and change the following;
<property name="hibernate.c3p0.max_size">120</property>
2) Open the server.xml file in the installation directory/conf and change the following:
maxThreads="100"
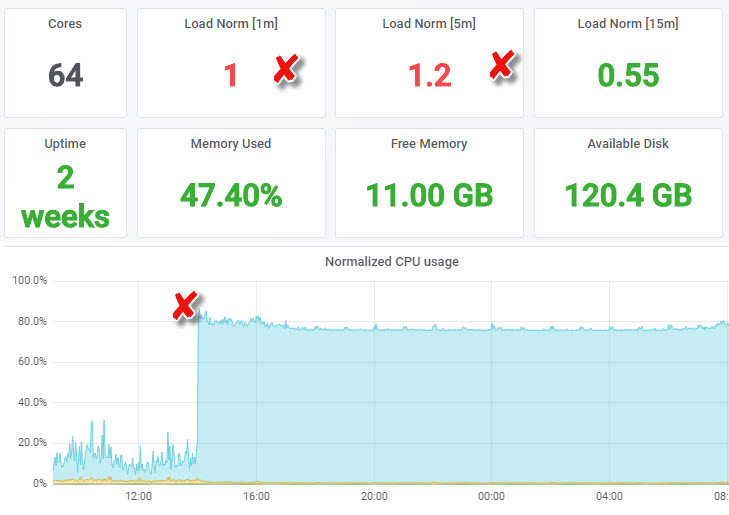
This morning, a Confluence process is currently consuming over 75% of the overall CPU. I am not sure if this is related. We plan to restart the Confluence service at 8PM tonight as long as the CPU stays around 80%.
Anyone have any other suggestions to resolve high CPU/load/thread issues? If not, I will open another case.