Hi everyone,
I am using a combination of JIRA, Confluence and Bitbucket for the development of a medical device software and for documentation purposes. While I am very happe with the structure I have set up so far, I have one unsolved problem with visualizing my documentation.
Basically I have a three level structure of my issues:
- Requirements (defines SW-requirements)
- Specifications (specify Requirementstickets)
- Worktickets (new function, improve function, Bug, Test [using Zephyr plugin here])
This works flawlessly, and I have a fully consistent documentation (compliant with EN 62304 standard). However the most important step is to create documents, that I can put into my technical file or at least generate when audited. And here is where I need your help.
I have tested a plugin called TraceabilityX by excentia, which is actually wonderful. It does precisely what I need however with one major flaw:
It can only visualize two levels and I need to visualize three levels. However the way it is displayed is absolutly perfect. (The picture is actually from the traceabilityX doc and it perfectly shows what I need.)
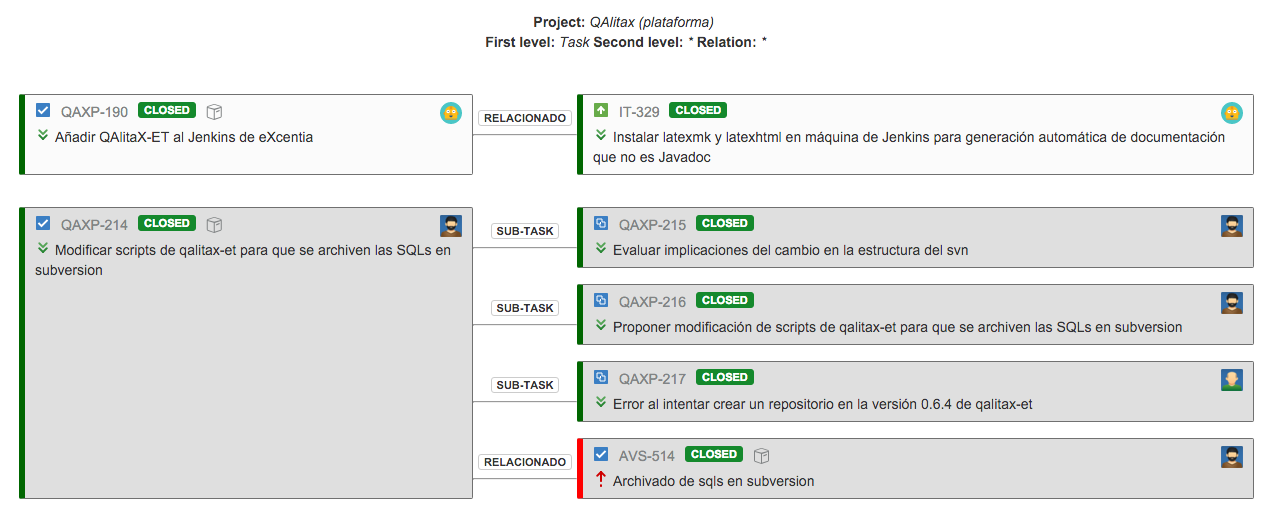
Can you guys recommend me a similar plugin, that can actually provide clear visualization of three levels of issues?
That would help me a ton.
Thanks in advance and best regards,
Oliver
Edit: Just to give some insight to what I have tried already and why it did not fit:
- Vivid Trace: Has a wonderful multilevel visualization, however there is no way for me to adapt the bubbles, so I can actually read the Ticket-info. Also I have not found an export function other than graphics export.


