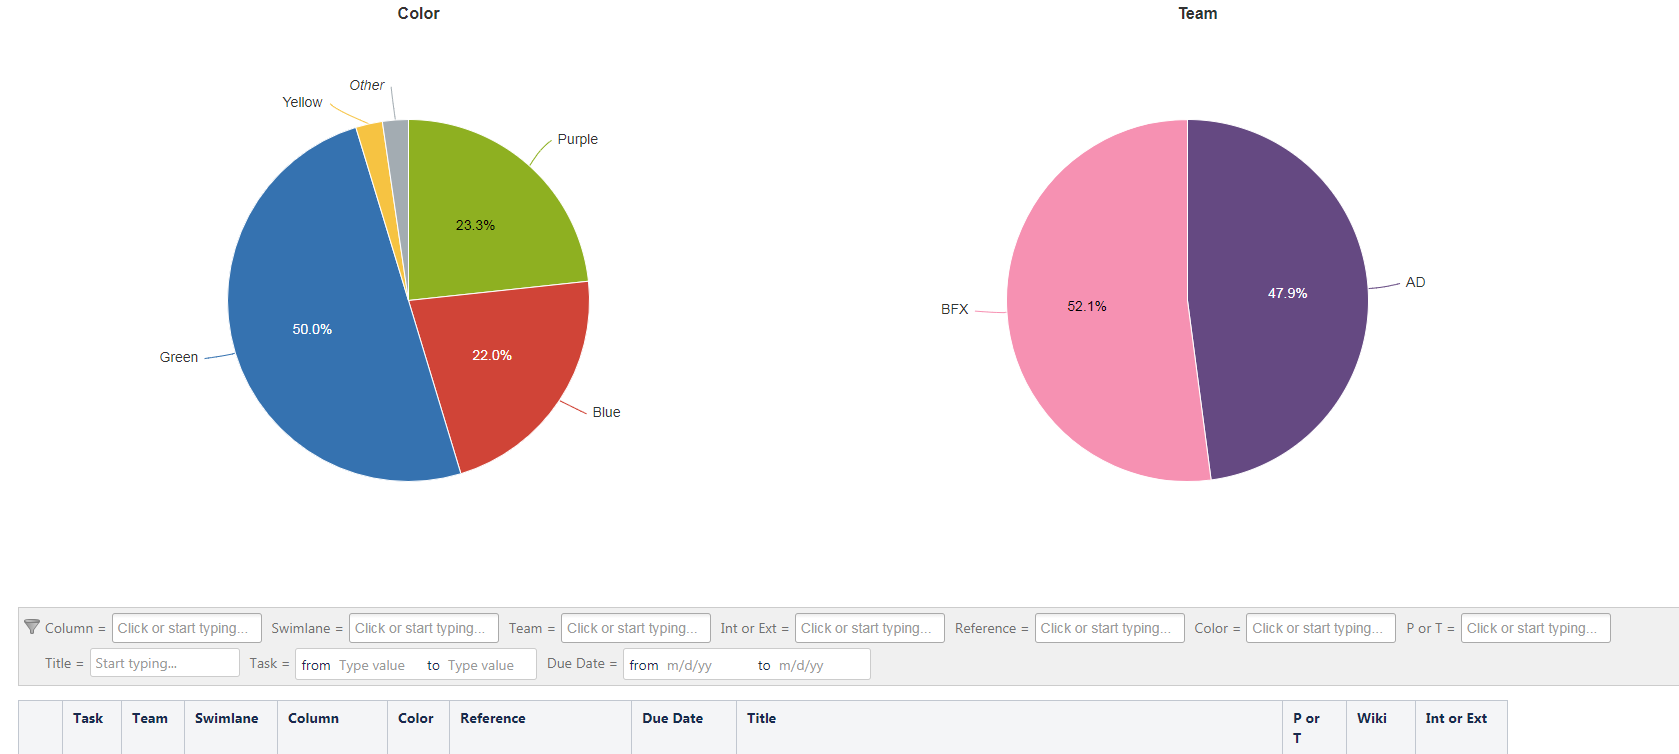
Hi - I am trying to use the Chart from Table macro and customize the look of my graphs and tables but cannot figure out how to get access to all of the parameters mentioned in the documentation. I see that the parameters change when I change the chart type but they still seem to be mostly missing.
In the attached example I am trying to do obvious things like change the colors of pie slices to match the labels, replace the percentages with values and get the values to be the counts of my task numbers versus their sum which is not particularly useful.
Are such things possible?
Thanks,
Daniel F.
Here is an example of my chart: