Supported Platforms
If you're reading this and it's not just educational… we know you're unhappy right now and apologize for that  We're dedicated to improving your Sourcetree experience.
We need your valuable feedback though to help narrow down the problem and ship a fix that much faster. Here are some high level details on what we've already built into Sourcetree to aid in flipping the switch from:

macOS
Visit the Advanced preferences pane and turn on the Debug menu to make it easier to access options and logs. As noted, some changes (such as the log level) require you to restart the app for them to take effect.
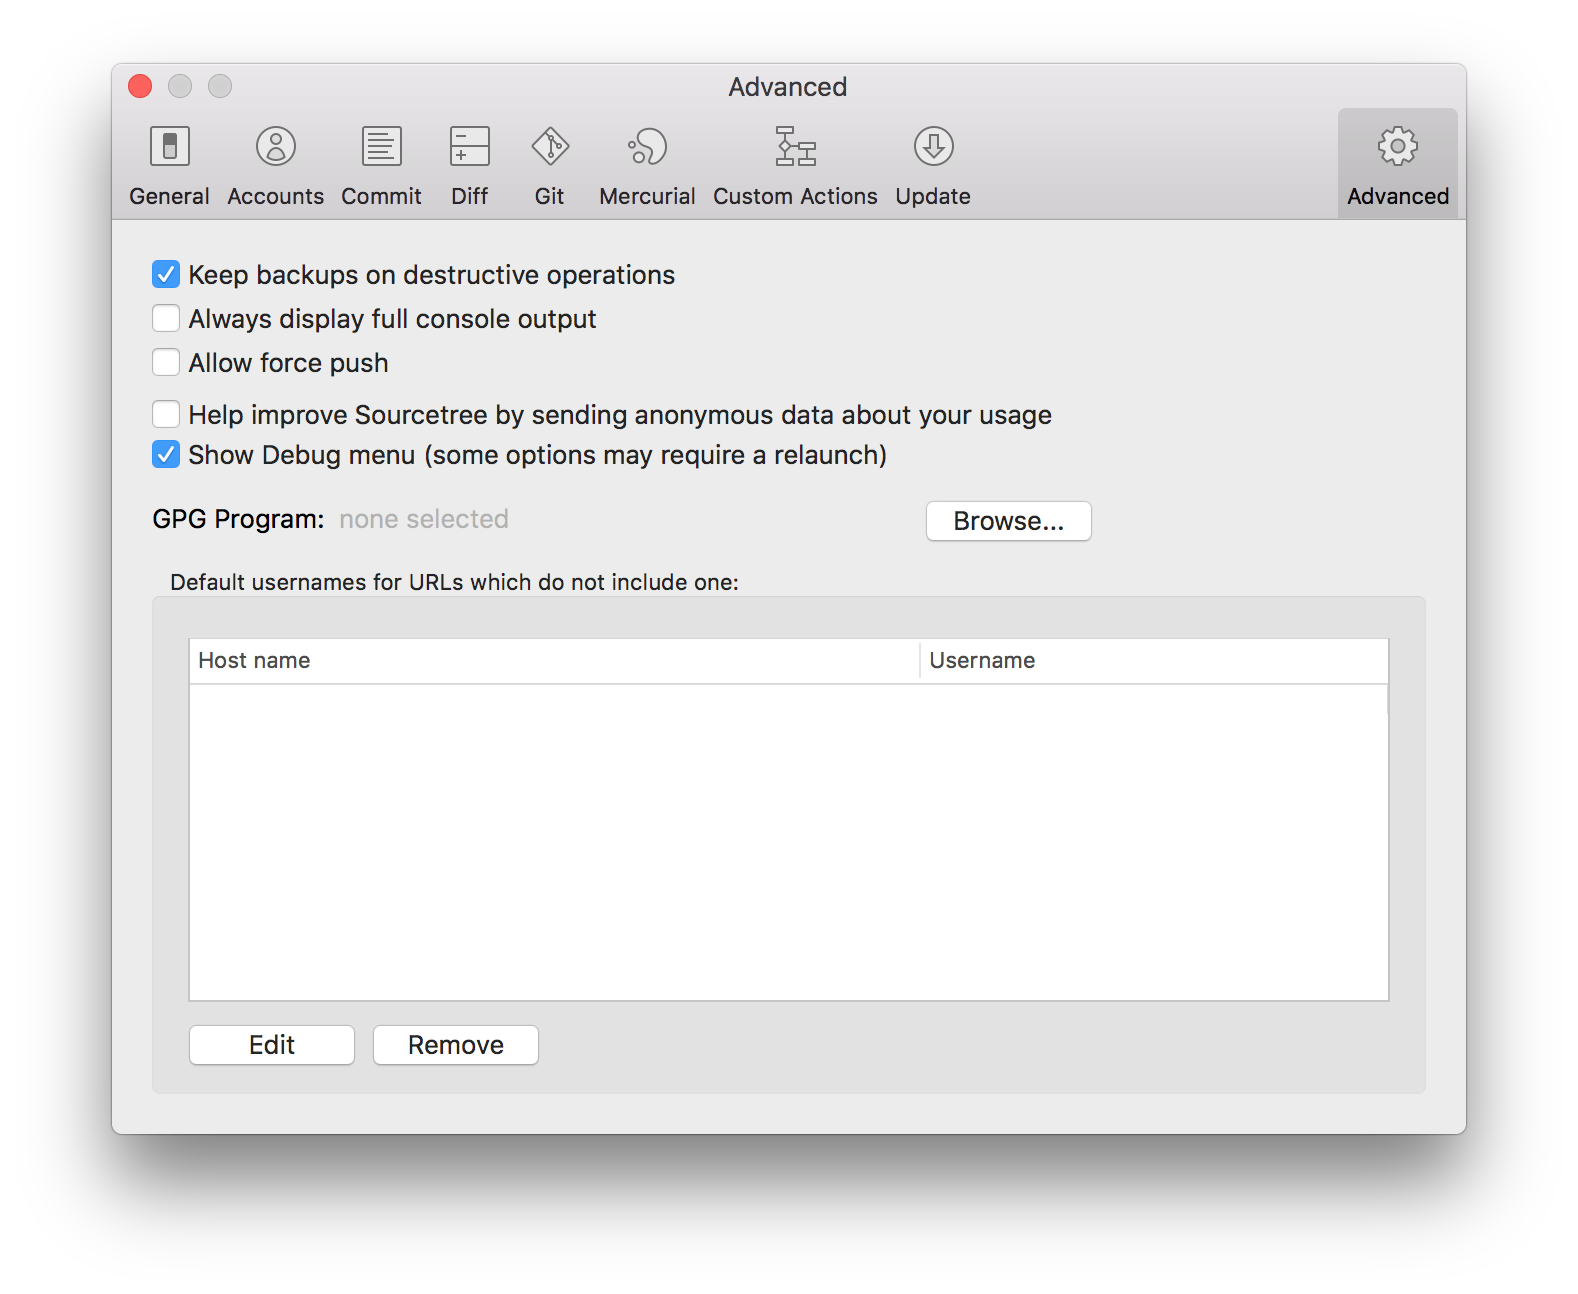
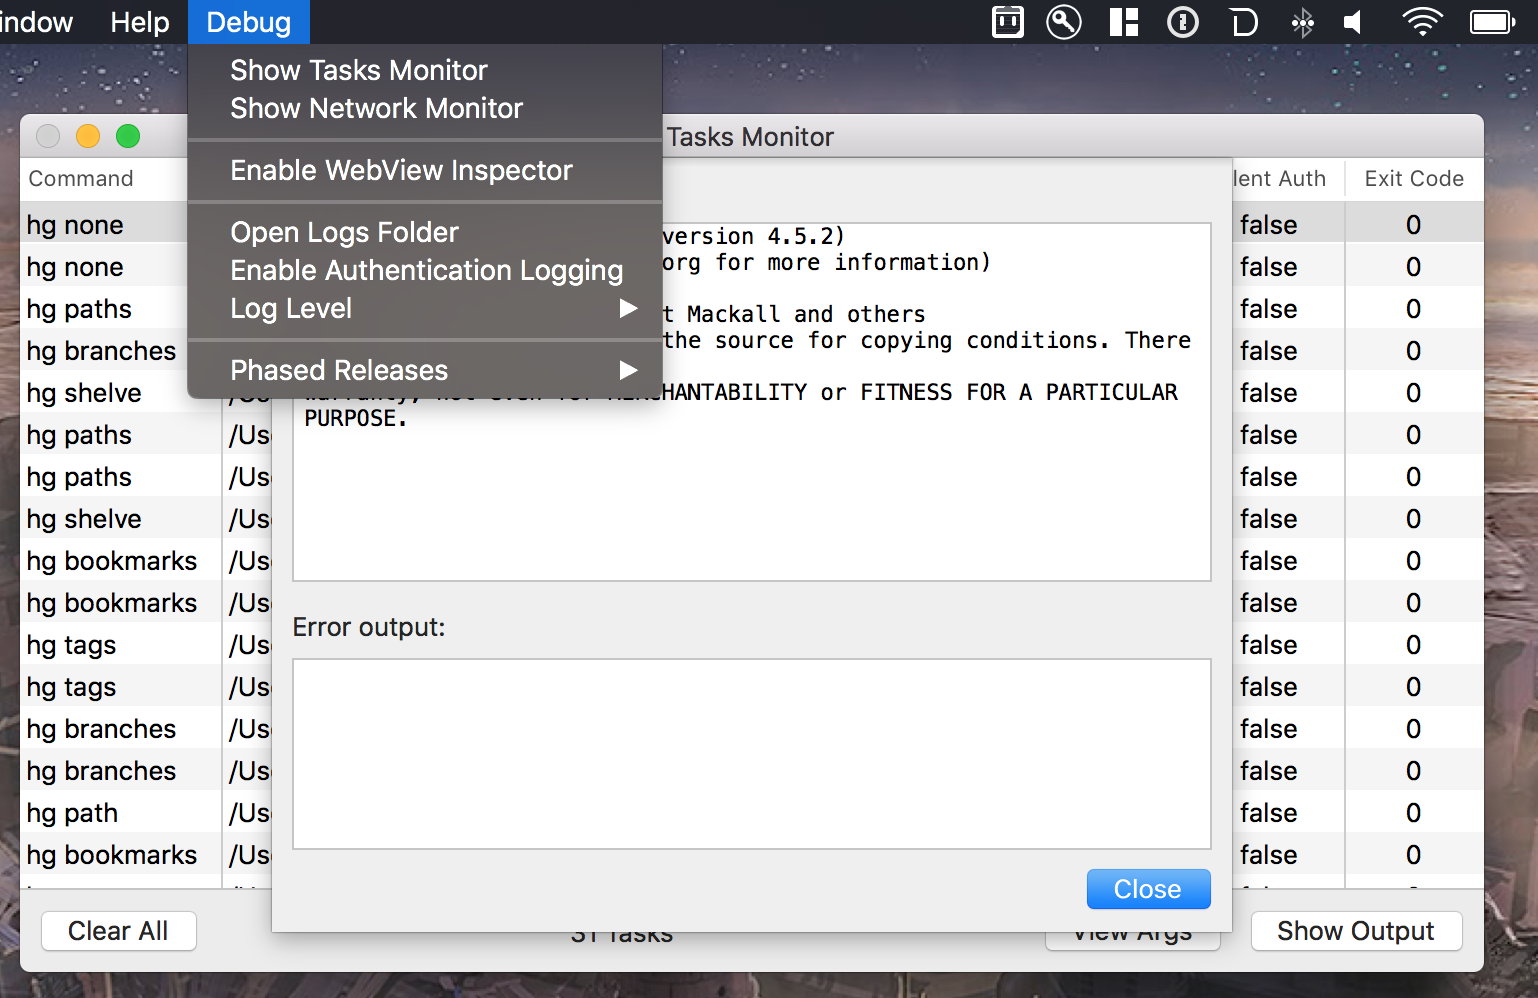
Once the Debug menu is enabled, you can:
- Change several logging settings
- Open up debug monitors and inspectors to see what's going on
- Use the Tasks Monitor to help determine what actions are being run in response to a particular click
- Use the Network Monitor to help determine what activity is generating traffic unexpectedly, such as populating the remote repositories list in the background
Windows
It's even easier to get started finding behind the scenes activity on Windows via the Process Log under the Tools menu. When you open it, you'll see data presented like so:
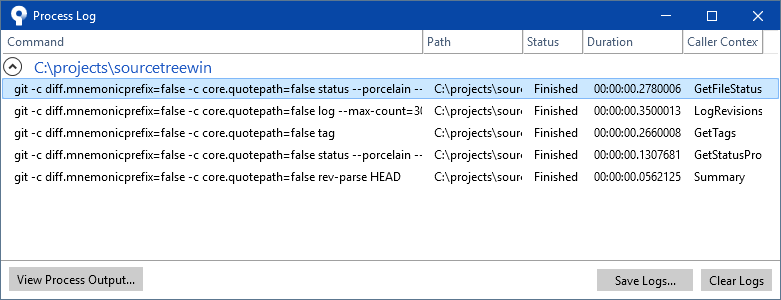
To enable logging in general for the app you'll need to edit %localappdata%\SourceTree\app-<span>{version}</span>\log4net.config and set the value to DEBUG. (more details) Once you've done that you'll find the output in %localappdata%\Atlassian\SourceTree\sourcetree.log.
Despite the playful gifs and useful functionality we built in, it's never fun to run into a problem with tools you depend on day in and day out. We appreciate you taking the time to learn what's available to help file the most informative and actionable tickets possible.

Thank you for your help in eliminating those pesky bugs!
Note: debug data is generated only a when monitor is open and none of it is ever transmitted off your machine
Additional Reading: