Hi Friends,
I want to pullout a cycle time report from JIRA between two columns (Analysis & Done).
Can any one of you suggest how to achieve this?
Thanks,
Karthik
Control chart is something you can use.
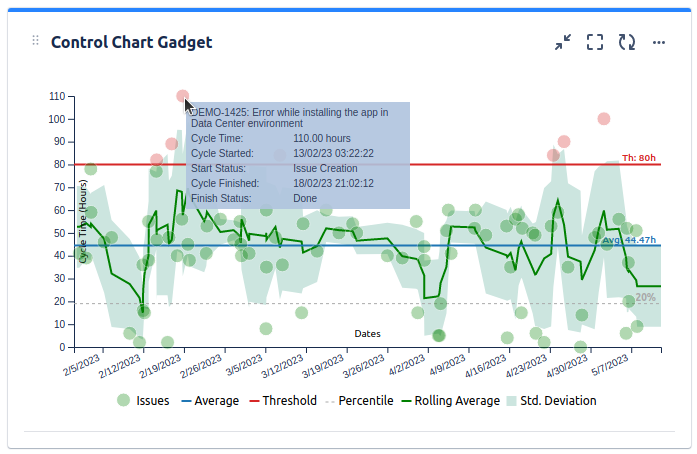
About the Control ChartThe Control Chart shows the Cycle Time (or Lead Time) for your product, version, or sprint. It takes the time spent by each issue in a particular status (or statuses), and maps it over a specified period of time. The average, rolling average, and standard deviation for this data are shown.
https://confluence.atlassian.com/jirasoftwareserver/control-chart-938845628.html
Hi Tarun,
Thanks. It was useful.
Your welcome. Could you please accept/up-vote the answer so that other's are helped.
Tarun, Cycle Time and Lead Time are different metrics. CT is how long an issue is in a certain status. LT is how long it takes an issue to be completed from the time of creation.
Any ideas on how to actually get lead time?
HiThat is true, you may use eazyBI to analyze reaction time, lead time or time between two transitions.Out of the box, you will get a measure for issue resolution time and issue close time. But you may define calculated measures to get time between two transition date which represent lead time in your business case. For example, calculate time from entering "Open" status for the first time, till entering status "Delivered to customer" for the last time (see picture below).
You may check out eazyBI demo account for some sample reports, like issue resolution time intervals, resolution time boxplot chart, issue age reports and other.We have also demo account for Service Desk reports.
Best,
Zane / support@eazyBI.com
Our Great Gadgets add-on offers a Cycle Time Trend Gadget that might be helpful for you. It uses a Jira filter as input can can be configured to calculate lead time, cycle time or time between two statuses. The gadget can also display a data table, which contains the cycle of every issue.
As far all I have found in multiple searches, only EazyBi can do this.
One question - what does 'Average resolution days' mean? Isn't the number generated from resolution date minus created date? That wouldn't be an average.
You are right; Average resolution days return time between creation date and resolution date, it could be used to represent Lead Time.
For a single issue, measure returns total resolution time. For a set of issues, measure returns an average resolution time over those issues, and this is why it is called Average resolution days. For example, you may use measure Average resolution days and Time dimension to see average lead time for issues which are resolved in each period.
Some report examples for resolution time (lead time) analyses you may check out in eazyBI demo account (https://eazybi.com/accounts/1000/dashboards/4553-jira-issues-dashboard)
@Zane eazyBI Support I do not see the report you show in your screenshot in the demo. I have been searching high and low for a very simple cycle time report, but can't seem to find one or accurately create one.
If I'm not mistaken, the cycle time is the time from the start of the work until the work is live.
Your image looks like it might be able to help me. You Custom LT Measures specifically. Your Custom LT column looks like it is the date the work start and the next column looks like the date the work was completed. The last column is the time in between.
Can you let me know how you created those custome LT measures?
Jira already provides two options, although it is not clearly called out.
1) Control Charts
2) Resolution Time Reports
Control Charts
The control chart lets you select whatever columns you want to contribute to cycle time. It also lets you use quick filters and swimlanes to reduce the selection of items contributing to the cycle time report etc.
Since cycle time and lead time are the same if you are measure all processes you can just select all your columns.
If you do that the calculation is Lead time
(ps. if you aren't a purist and don't feel like there is only one true lead time, you'll find that there are many types of lead time in the manufacturing space, and the difference is all about when you consider the start and end of lead time).
Resolution Time Reports.
The resolution time report lets you select a period the report over and the sampling rate (buckets) - eg monthly, weekly etc etc.
The link below provides the specific on how Resolution Time is calculated
https://confluence.atlassian.com/jirakb/how-resolution-time-is-calculated-278072482.html
Note: I mentioned this in a comment but am moving it to an answer so that it can hopefully be accepted as a specific answer.
Hi @Karthik Balasubramanian ,
Try our Great Gadgets app.
In the many dashboard gadgets included, there are Control Chart and Cycle Time Trend gadgets, which are based on Jira filters and are fully customizable. You can configure them to calculate by specific statuses, which allows calculating Lead Time, Cycle time or time between statuses. Optionally, both gadgets can display a Data table, showing the issue and their individual data.
Cycle Time / Lead Time Control Chart showing issues that took longer than expected:
Weekly Average Cycle Time / Lead Time and the trend:
Danut
It looks like you're new here. Sign in or register to get started.