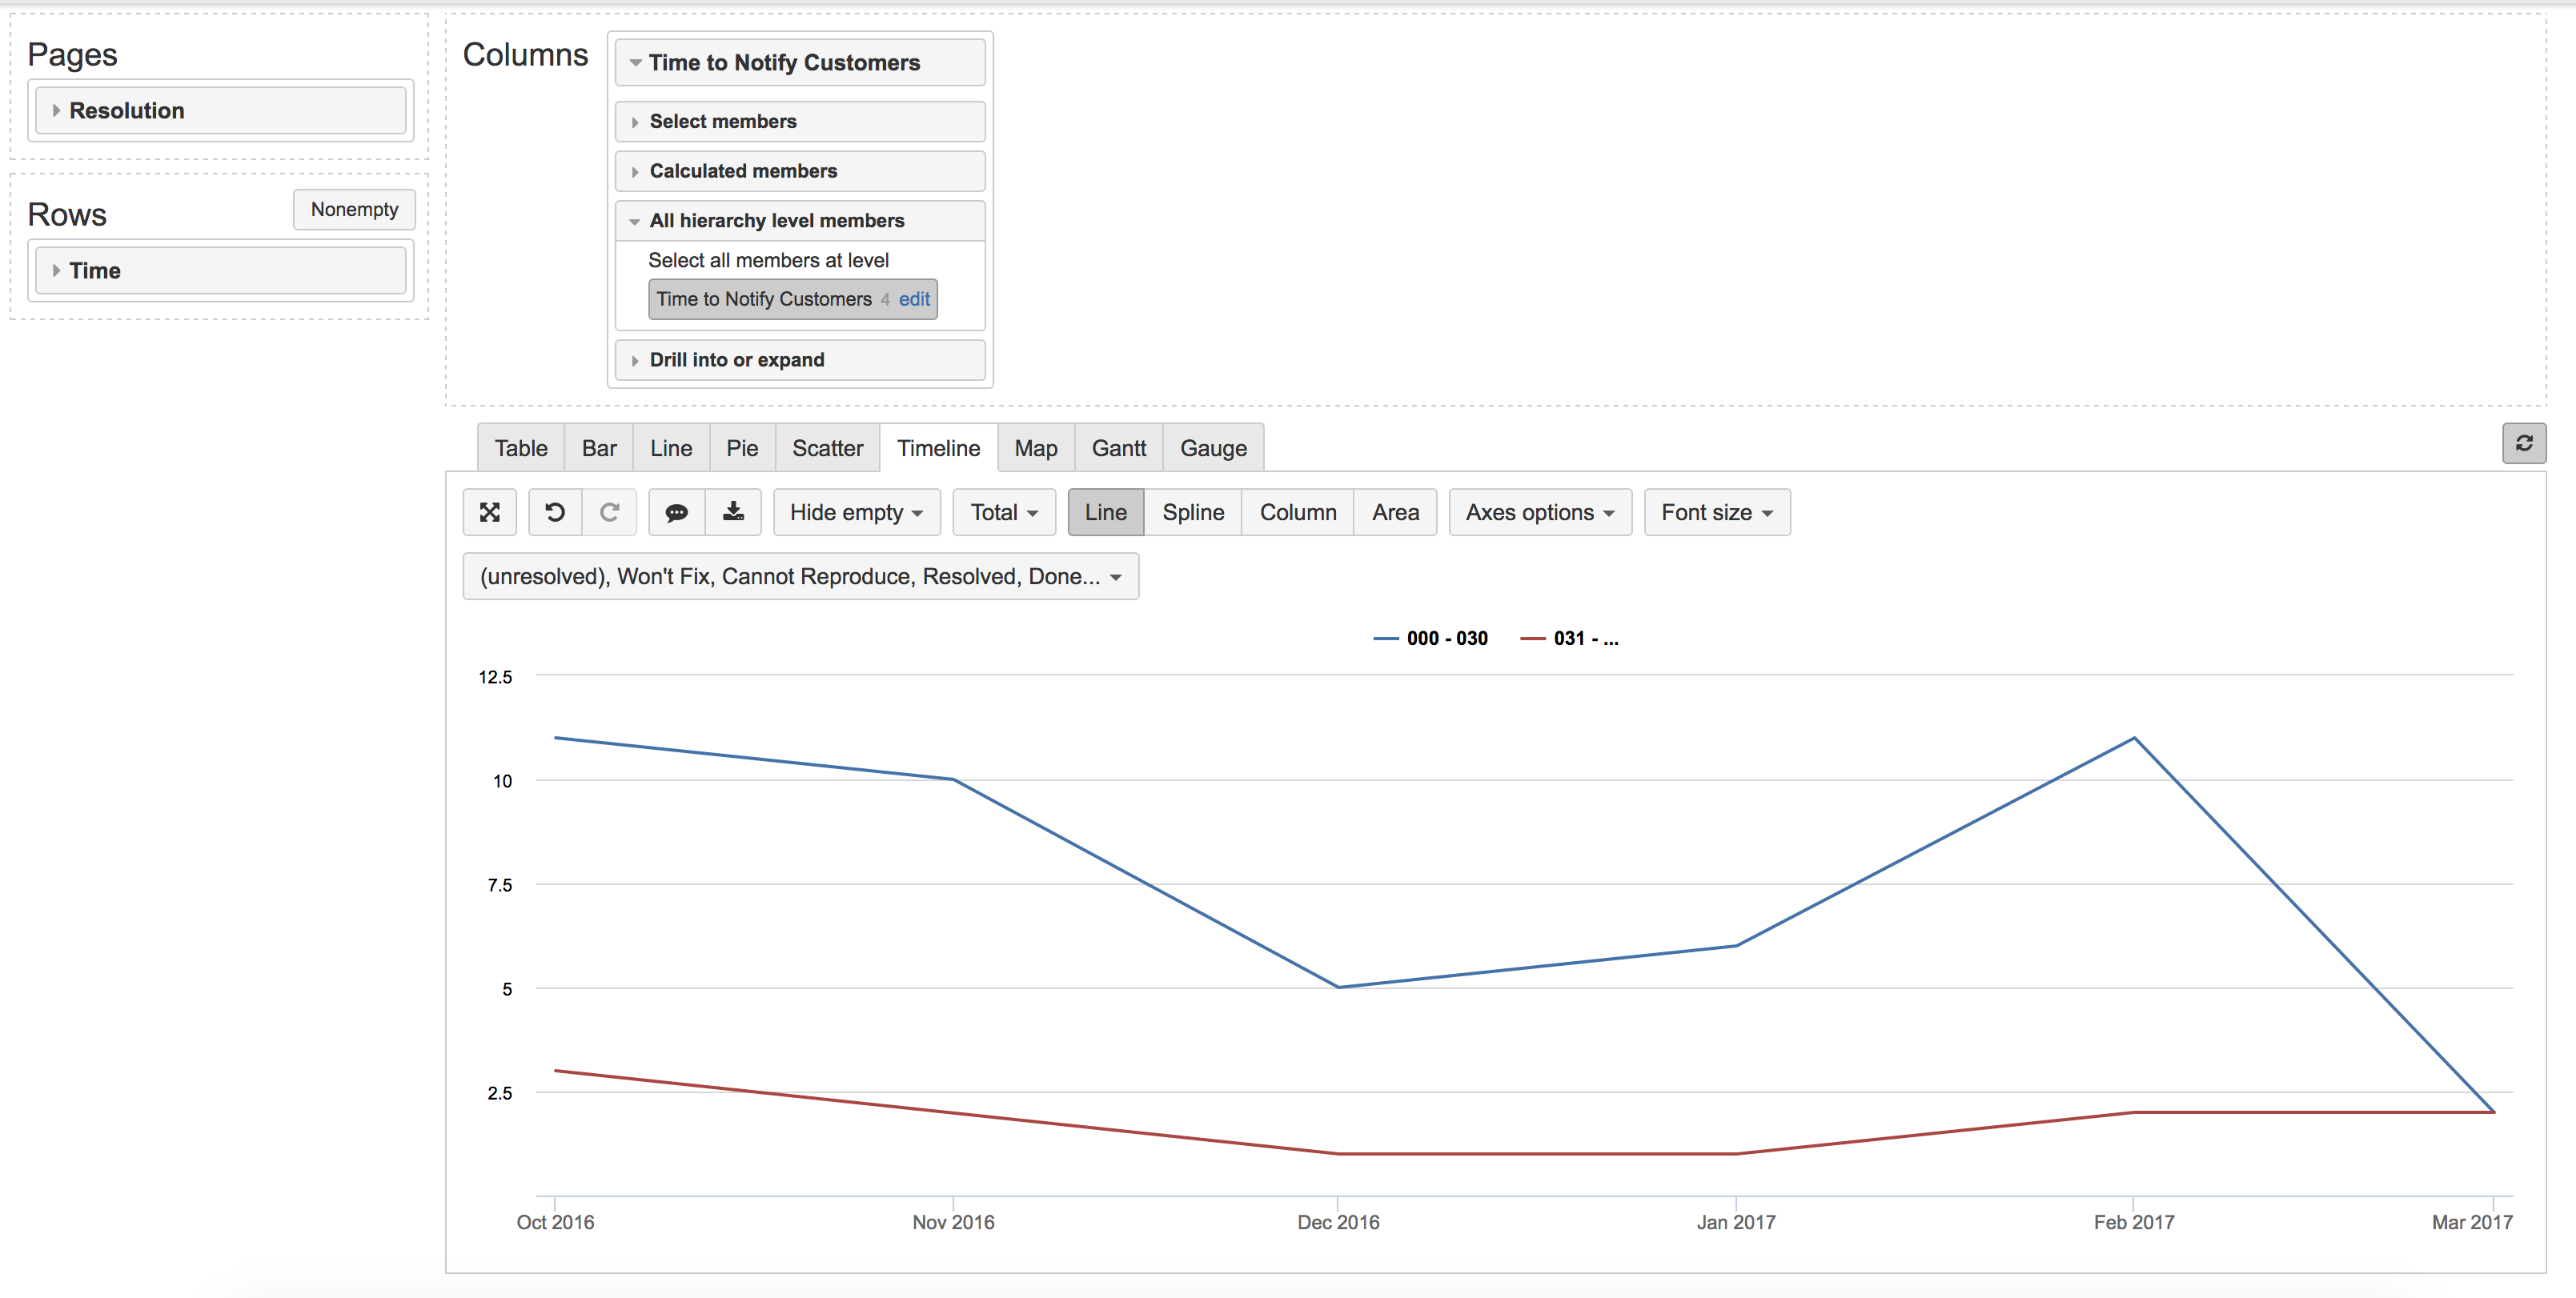
I have set up an interval for a custom number field called “Time to Notify Customers” in eazyBI, and I have set up a timeline graph (see image) to show the number of issues in each interval over time. I am trying to find a way to display this as a percentage over time of issues that are in the ‘000 – 030’ interval, but I can’t figure out how to do it. Is there a way to accomplish this? I'm assuming I have to create a calculated member but I'm not sure what the formula should be.