This guide shows how to build a custom data model and metric in Jira Service Management Analytics, then use them in a dashboard. You’ll learn how to combine work item data with Assets context so your team can understand which applications, services, or owners are most affected by incidents.
Example scenario: You want to understand how many incidents, changes, or other work items affected applications stored in Assets in the last 90 days.
What you can learn
Combining work item and asset data gives incident counts useful operational context. Instead of seeing only how many incidents were raised, you can understand:
- Which applications or services are affected most often.
- Whether incidents are concentrated in high-criticality assets.
- Which owners or teams may need to follow up.
With this approach, your teams can move from basic work item counts to richer insights about the applications, services, and assets that affect your business.
📘 Before you start
Make sure that:
- Your work items contain an Assets custom object field that links them to the relevant objects.
- You have access to the Custom Models and Metrics feature in EAP.
For more information on how to sign up for the EAP, go here: [Get Early Access] 📊 Improved Assets & Work Item Analytics for custom analytics needs
📹 Video Demo
Step by Step Instructions
🏗️ 1. Create a data model
A data model combines work item data with asset data. It gives you a reusable foundation for metrics and dashboard charts.
- Open the Analytics app in Jira Service Management.
- Go to the area for Data models.
- Select Create data model.
- Add the Work item table and the relevant Assets Object Type containing your objects.
For this example, I am selecting a custom Applications object type which I have.
📋 2. Select and filter the columns you need
Select columns that will be useful for analysis. Include the work item fields needed to identify and filter work, along with the asset attributes you want to use in charts.
Data source | Useful columns | Why include them |
|---|
Work items | Work item key, title, type, status, created date | Identify and filter the work being analysed |
Assets | Object key, application name, tier, owner | Group work by the asset and its business context |
Linked field | Linked asset field name, Linked asset object key | Ensure the model uses the intended asset relationship |
Why column selection matters: Columns selected in the data model can become grouping or filtering options when you create metrics and dashboard charts.
Optionally, add filters such as Work type = Incident and Created date = last 90 days if you only want to analyse recent incidents linked to applications. You can also apply the 90-day range later as a dashboard date filter, depending on how you want people to interact with the chart.
🔍 3. Join the work items and assets
Use the relationship between the work item and the asset to join the two data sources. In the application example, join the work item’s linked asset object key to the application asset’s key.
- Open the join configuration in your data model.
- Select the “Linked asset object key” column from the Work item table.
- Select the “Key” from the Applications table.
- Press Save and Run.
- Confirm that the results contain only work items linked to the application assets.
Important: If your work item has several Assets object fields, use Linked asset field name to confirm you are joining the correct relationship. If a work item can link to multiple assets, your join may create one row per linked asset. That can be useful for asset-level analysis, but it may inflate counts if you expect one row per work item.
✅ 4. Validate and publish the data model
Before creating a metric, validate that the model returns the rows you expect.
- Review a sample of the model results.
- Apply any final filters, such as Work type = Incident or Created date = last 90 days, if you want the model itself to stay focused on a specific scenario.
- Publish the data model so it can be used for custom metrics and dashboards.
🔢 5. Create a custom metric
Next, create a metric that counts the work items linked to your Assets objects.
- Go to Metrics in Jira Service Management Analytics.
- Select Create metric.
- Choose the data model you published in the previous step.
- Select a count aggregation, such as Count of work item key.
- Name the metric clearly, for example Incidents linked to applications.
- Save the metric.
This metric now gives you a reusable count of work items connected to the Assets object type you selected.
📊 6. Add the metric to a dashboard
Use the metric in a dashboard chart to make the asset relationship visible to your team.
- Open the dashboard where you want to show the insight.
- Add a new chart or tile.
- Select the custom metric you created.
- Choose a visualization that matches your question, such as a bar chart, table, or line chart.
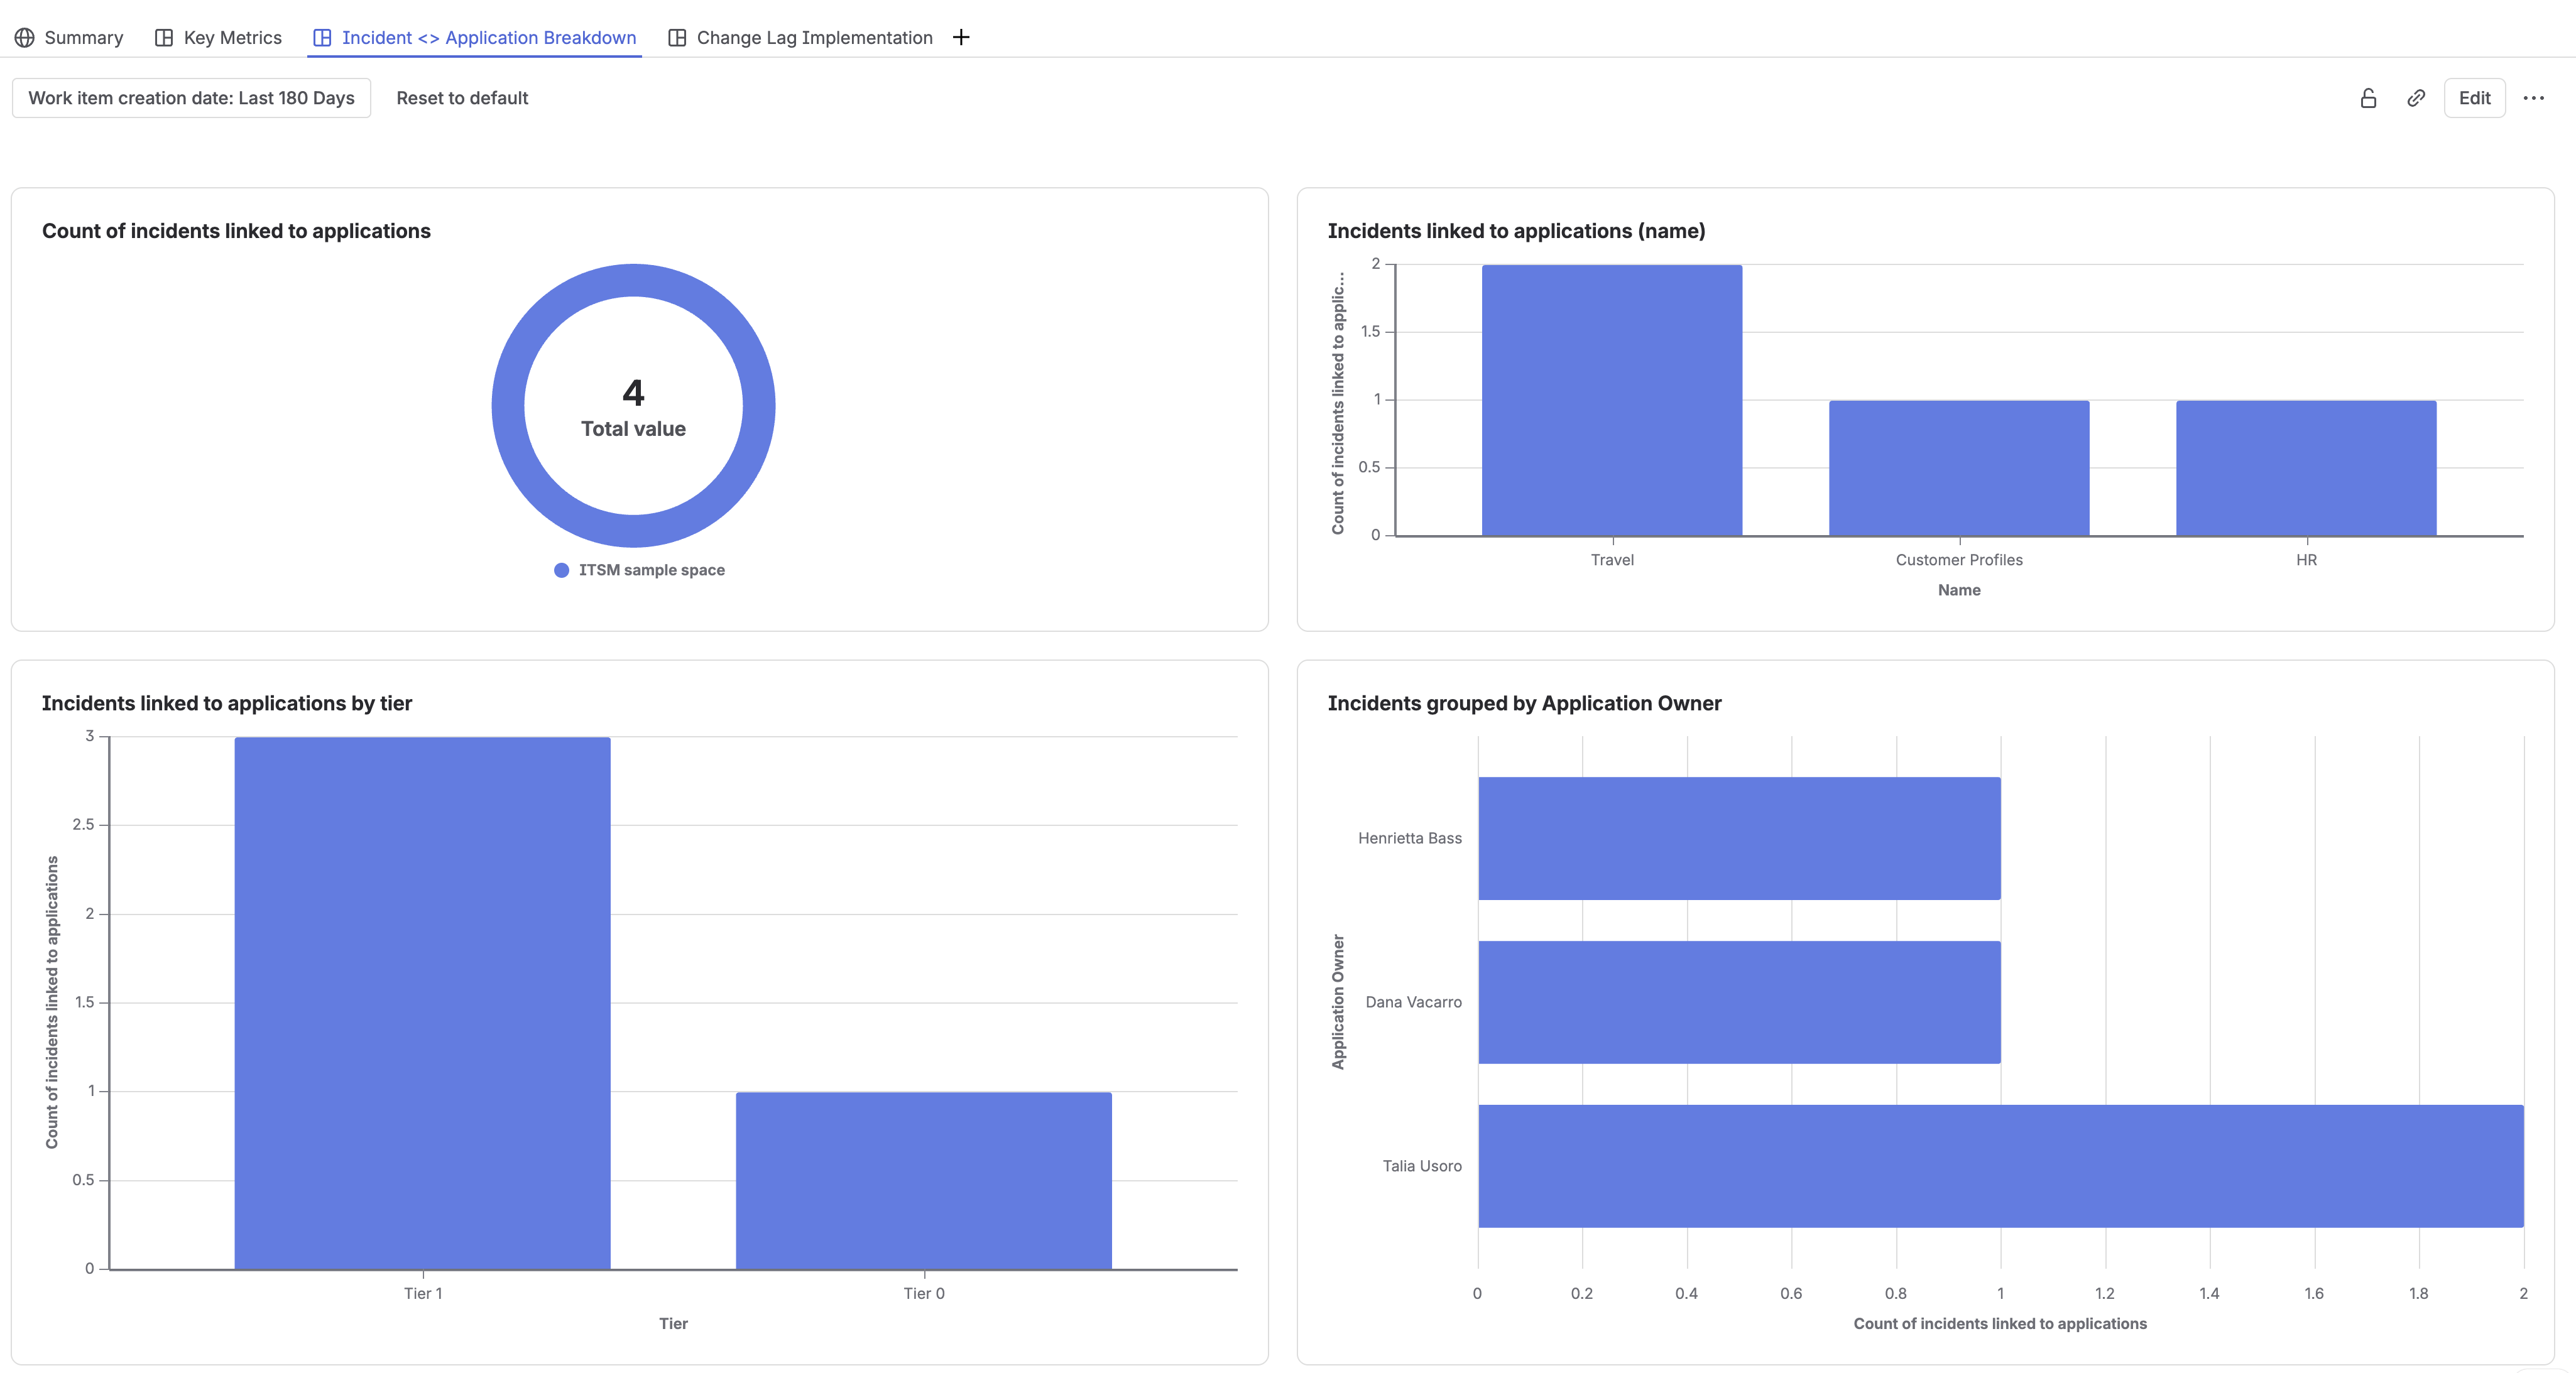
- Group the metric by an Assets attribute, such as application name, tier, or owner.
- If you did not apply the time range in the data model, add a dashboard filter for Created date = last 90 days.
For example, you might create a bar chart that shows incidents by application owner, or a table that lists the highest-incident applications by tier.
🛠️ Troubleshooting tips
Reach out to the product team in case you face any issues using this form: Ask a question/ Give Feedback
💬 Share your feedback
What custom metrics or asset relationships are you looking to track next? Drop your thoughts, questions, or use cases in the comments below.

