Your Jira integration suddenly stops syncing.
You check the logs and find:
429 Too Many Requests
You check Jira.
Jira is working normally.
So what happened?
Your integration may have hit a Jira API rate limit.
And this is where troubleshooting usually gets difficult.
You know Jira is rate limiting requests.
But you still need to answer:
Which limit did we hit?
Which integration is affected?
Is this a one-time spike or a recurring problem?
How do we know before it happens again?
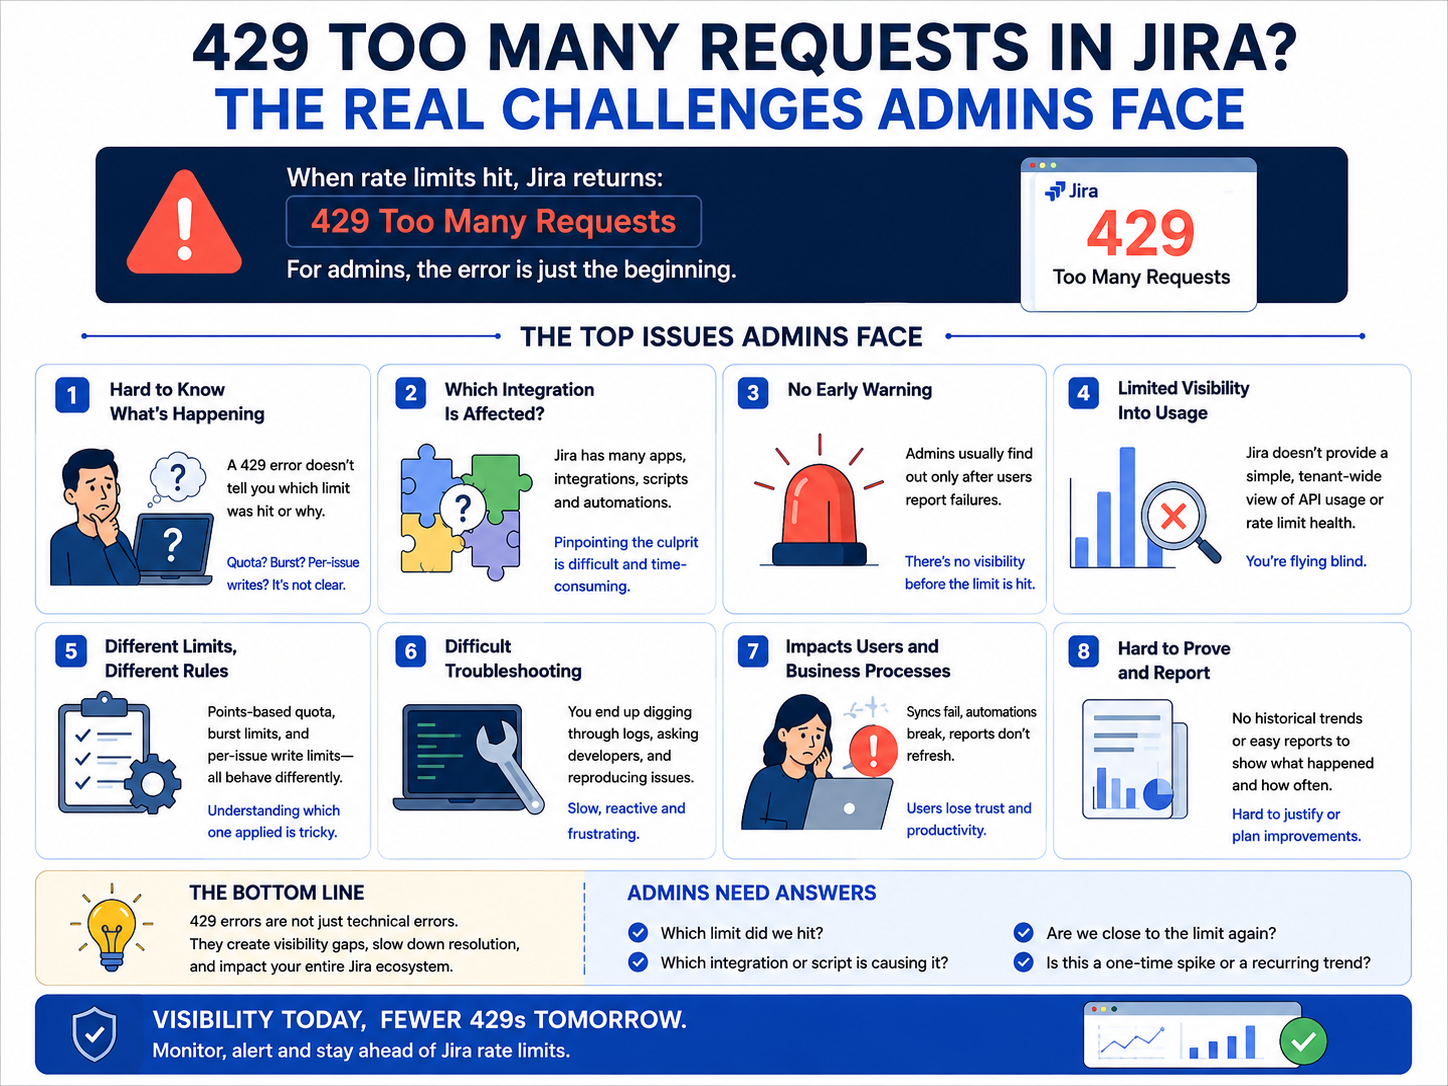
What is a Jira API rate limit?
Jira Cloud limits API traffic to protect the platform from excessive or sudden API activity.
Atlassian currently has three rate-limiting mechanisms:
When an applicable limit is exceeded, Jira can return:
429 Too Many Requests
The response includes a RateLimit-Reason that tells you which type of limit was triggered.
So a Jira API 429 error isn't one single problem.
The reason behind the 429 matters.
Why does Jira return 429 Too Many Requests?
There are three common rate-limit scenarios.
1. API quota exceeded
Jira's points-based system measures API consumption in points, not simply the number of requests.
The default Global Pool is 65,000 points per hour per app, shared across that app's tenants.
So:
10,000 API requests doesn't necessarily mean 10,000 points.
Different API operations can consume different numbers of points.
2. API burst limit exceeded
Your integration may still have hourly quota available but send too many requests in a short period.
That's a burst-rate problem.
Atlassian's default steady-state burst rates are:
| Method |
Requests/second |
|---|
| GET |
100 |
| POST |
100 |
| PUT |
50 |
| DELETE |
50 |
Some endpoints have custom limits.
This is why you can see:
429 Too Many Requests
even though the hourly API quota hasn't been exhausted.
3. Too many writes to one issue
Jira also limits write activity against an individual issue.
The current limits are:
Exceeding these limits can also result in a 429 response.
But who is actually causing the Jira API limit?
This is the question Jira administrators often struggle with.
Your Jira site may have:
When an integration communicates with Jira, API rate limits can become relevant to that integration.
So when something starts returning 429s, the administrator needs to know:
Which integration is affected?
Not:
"Is Jira down?"
For administrators, Jira API rate limiting is therefore not only a developer concern.
Developers need to handle rate limits.
Administrators need visibility into rate-limit problems affecting the integrations their organization depends on.
The problem with discovering rate limits from a 429
Most teams discover the problem like this:
Integration
     ↓
429 Too Many Requests
     ↓
User reports problem
     ↓
Developer checks logs
     ↓
Admin investigates
That's reactive.
A better approach is:
Monitor
   ↓
Detect
   ↓
Alert
   ↓
Investigate
   ↓
Fix
The earlier you know API usage is approaching a problem, the more time you have to investigate.
What should you monitor?
If you're responsible for Jira integrations, these are the important questions:
API consumption
How much API capacity is being consumed?
Rate-limit status
Are we approaching a limit?
429 errors
Have we already been rate limited?
Limit type
Was it quota, burst or per-issue limiting?
Trend
Is API consumption increasing?
Integration
Which integration should we investigate?
That's the information a Jira API usage tracker or Jira API limit dashboard should make easy to understand.
Don't wait for the next 429
Imagine seeing this before an incident:
JIRA API HEALTH

● NEAR LIMIT

API CONSUMPTION
████████████████░░░░  81%

24h TREND
↑ Increasing

RATE-LIMIT EVENTS
2
Instead of discovering the problem after an integration fails, you know:
Something has changed.
Now you can investigate the integration, API traffic or configuration before the problem becomes bigger.
That's the difference between monitoring Jira API consumption and simply troubleshooting Jira API errors.
Meet QuotaWatch for Jira
QuotaWatch gives Jira administrators a simple way to monitor Jira API rate-limit health.
Instead of waiting for:
429 Too Many Requests
you can monitor API-limit signals and identify potential rate-limit pressure earlier.
With QuotaWatch, you can monitor:
API rate-limit health
Know whether your API usage is healthy, approaching a limit or experiencing rate limiting.
API consumption
Track how API usage changes over time.
Rate-limit events
See when rate limiting occurs instead of discovering it from an integration failure.
Rate-limit reason
Understand whether the problem is related to quota, burst limiting or per-issue writes.
Historical trends
See whether API usage is stable or increasing.
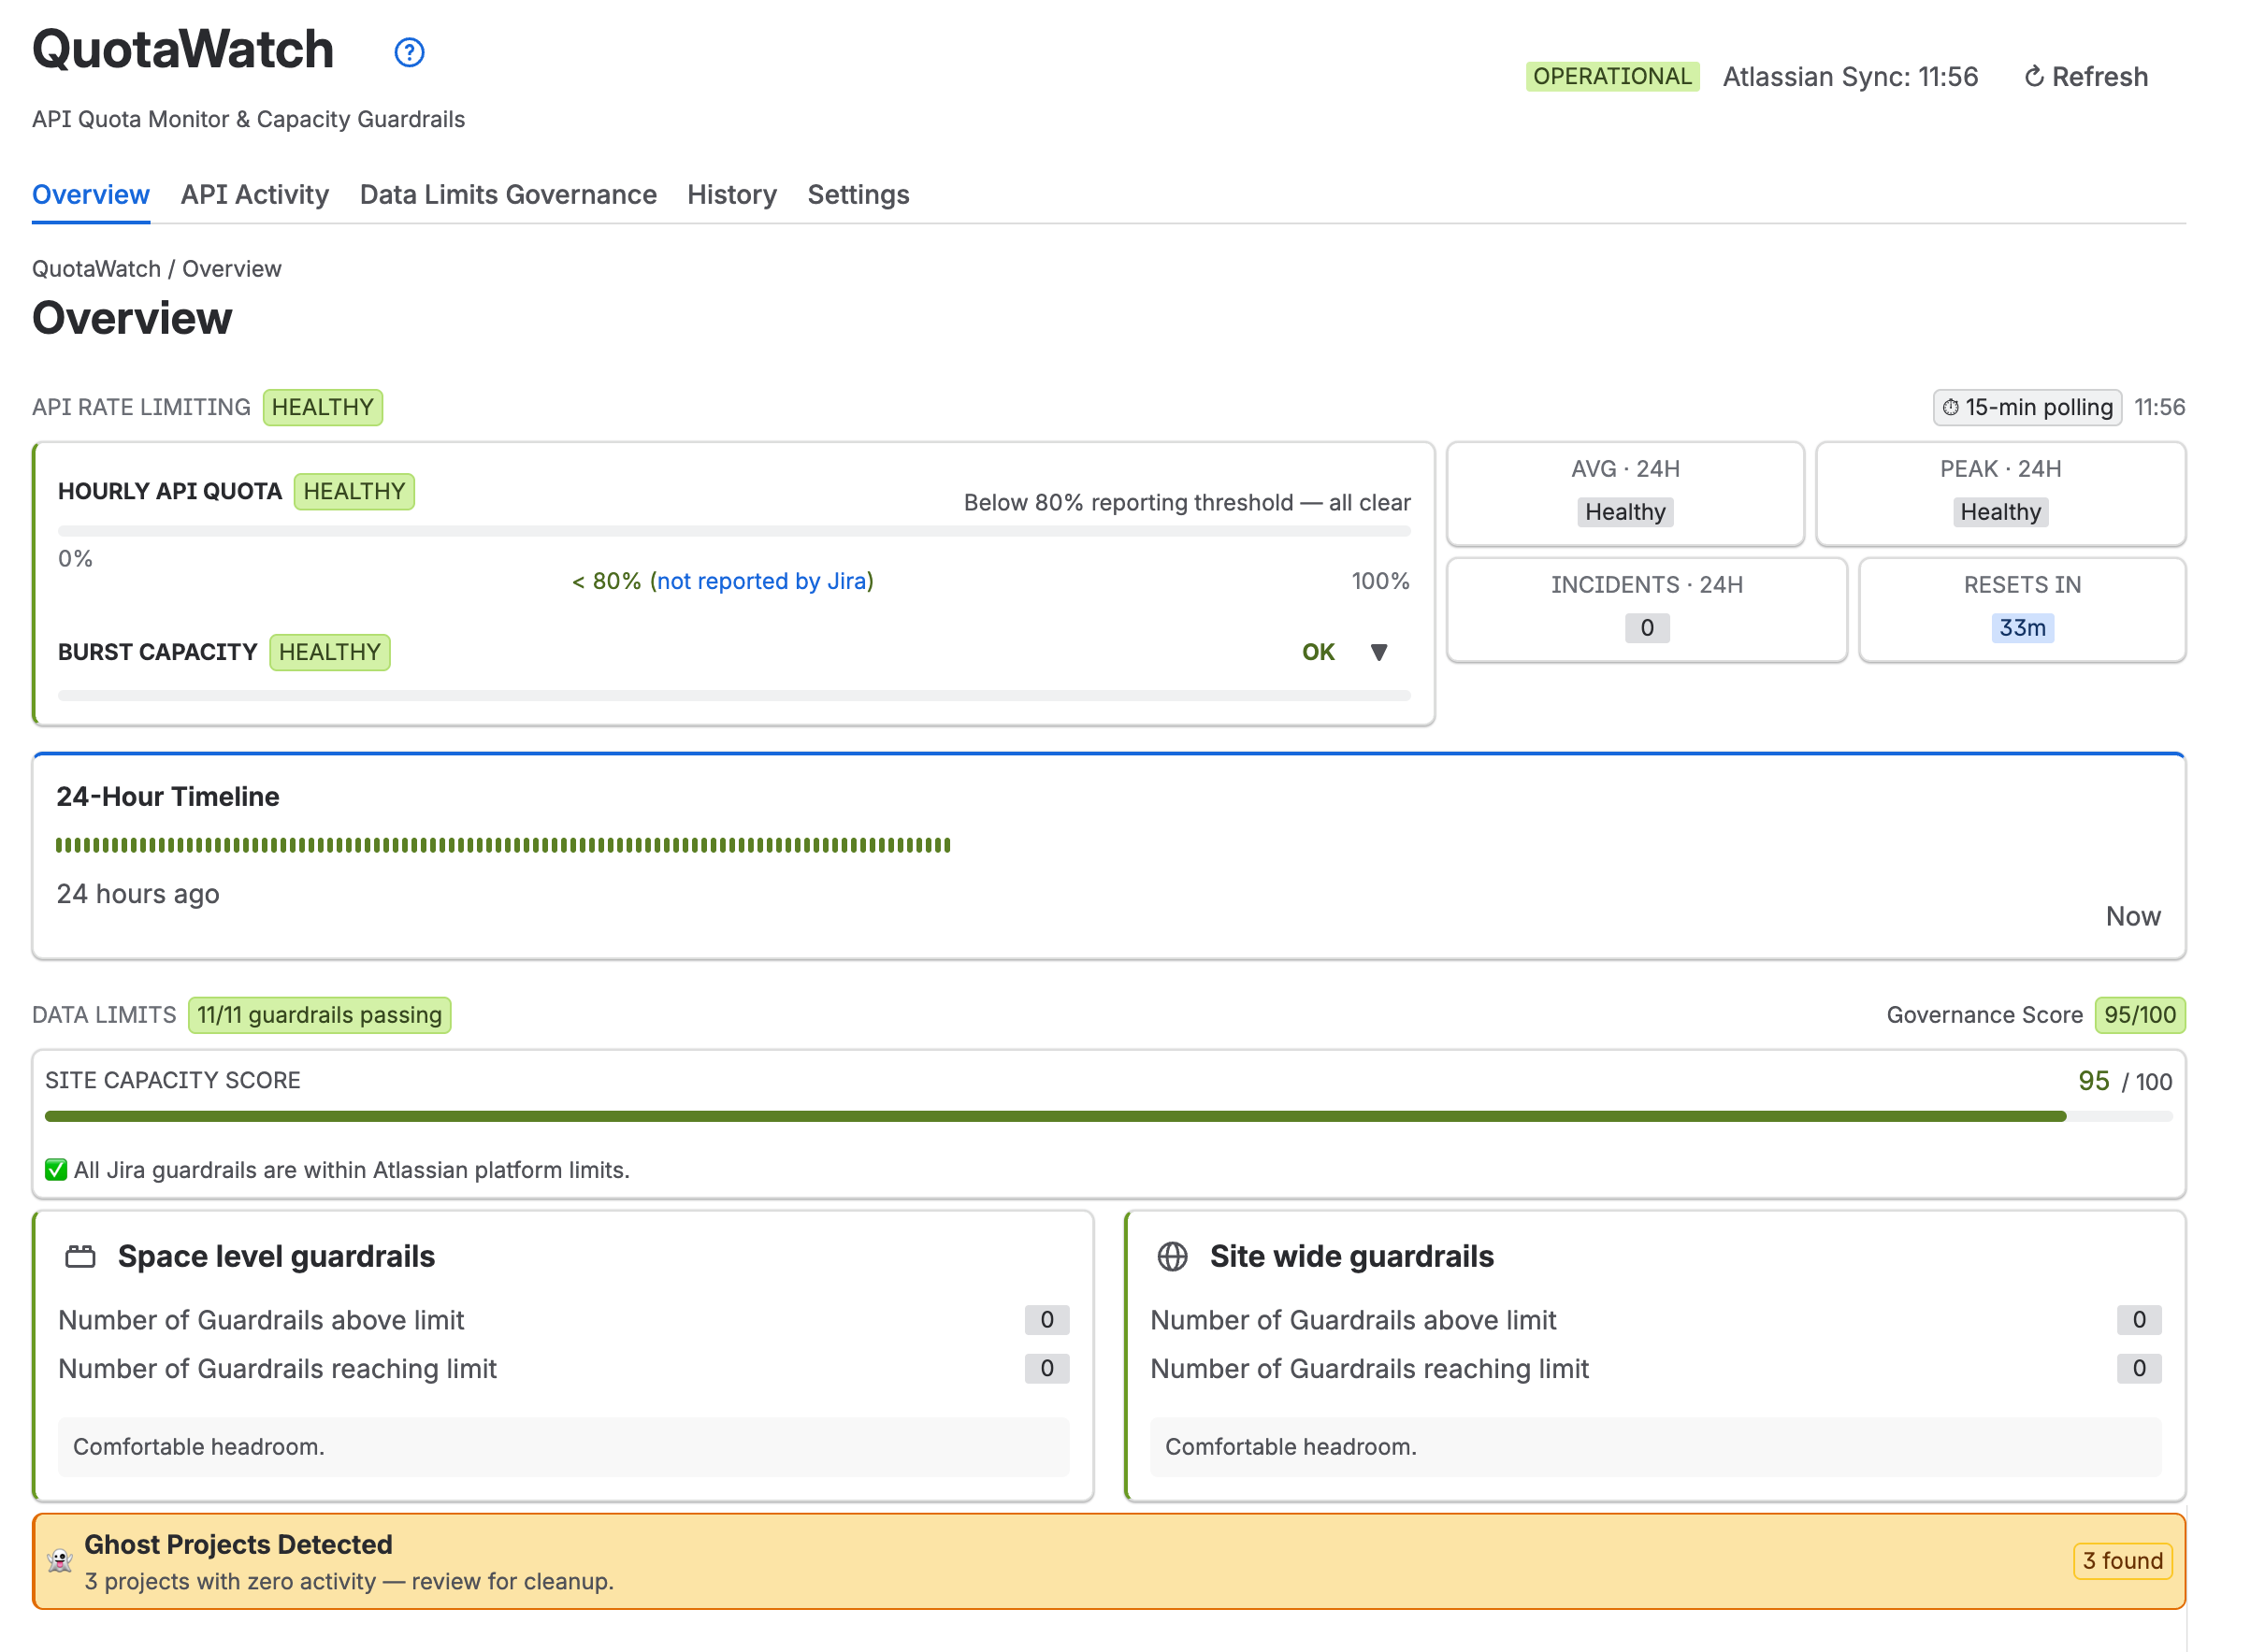
Also QuotaWatch helps us to know and manage your Jira Data limits and guardrails.
Why should a Jira admin install an API limit monitor?
Because the first sign of a Jira API problem shouldn't be:
"The integration has stopped working."
You should know that API activity is becoming a concern before users start reporting failures.
QuotaWatch helps turn:
429 error
   ↓
"What happened?"
into:
API monitoring
   ↓
"Something is changing."
   ↓
Investigate
   ↓
Take action
A simple Jira API health check
Ask yourself:
Can I answer these questions right now?
-
Are any of our integrations receiving Jira 429 errors?
-
Are we approaching an API quota?
-
Are we experiencing burst-rate problems?
-
Are individual issues receiving excessive writes?
-
Is API consumption increasing?
-
Which integration should we investigate?
-
Can we see this before users report a problem?
If you need to search through application logs, ask developers for data or manually investigate each integration, you probably don't have enough API visibility.
The bottom line
A Jira API rate limit isn't necessarily a problem.
Not knowing you're approaching one is.
Jira Cloud has multiple rate-limiting mechanisms, and a 429 Too Many Requests response can have different causes.
The important questions are:
What limit did we hit?
Which integration is affected?
Is it happening repeatedly?
Can we see the problem before the next 429?
If your Jira environment depends on multiple integrations, apps or automation, API rate-limit monitoring can give your team the visibility needed to answer those questions.
