
Jira is great at tracking work, but finance teams need answers to a different set of questions:
- How much have we spent on this project?
- Are we staying within budget?
- What revenue are we generating?
- Which teams or initiatives consume the most resources?
- Are we still profitable?
Unfortunately, Jira wasn't built for financial reporting. While it tracks issues, estimates, and worklogs, it doesn't understand labor costs, billing rates, profit margins, or budget consumption. As a result, many organizations still export Jira data into spreadsheets and manually combine it with salary information and project expenses.
To solve this gap, ActivityTimeline's Finances module turns Jira worklogs into real-time financial reports directly inside Jira.
From Jira Worklogs to Financial Data
The Finances module is built around three components:
Scope
Every budget starts by defining what work should be tracked.
You can create a budget based on:
- Jira projects
- Epics
- Saved JQL filters
This allows teams to monitor anything from a single client engagement to a cross-project initiative.
Labor Rates
Worklogs become financial data through rates.
Each user can have:
- Cost Rate (internal cost)
- Billing Rate (client-facing rate)
When time is logged in Jira, ActivityTimeline automatically calculates associated costs and revenue.
The system supports a rate hierarchy, allowing teams to define:
- Category-specific rates
- User-specific rates
- Budget default rates
The most specific rate always takes precedence.
ActivityTimeline also supports effective-date rate changes, ensuring historical reports remain accurate when salaries or billing rates change.
Financial Transactions
Not every project cost originates from Jira worklogs.
ActivityTimeline allows teams to record:
- Software subscriptions
- Contractor invoices
- Travel expenses
- Fixed-price milestone payments
- Recurring operational costs
These transactions appear alongside labor costs, providing a complete financial picture rather than a labor-only view.
Three Financial Reports Available in ActivityTimeline
Once budgets, rates, and transactions are configured, ActivityTimeline generates financial reports automatically.
Summary Dashboard
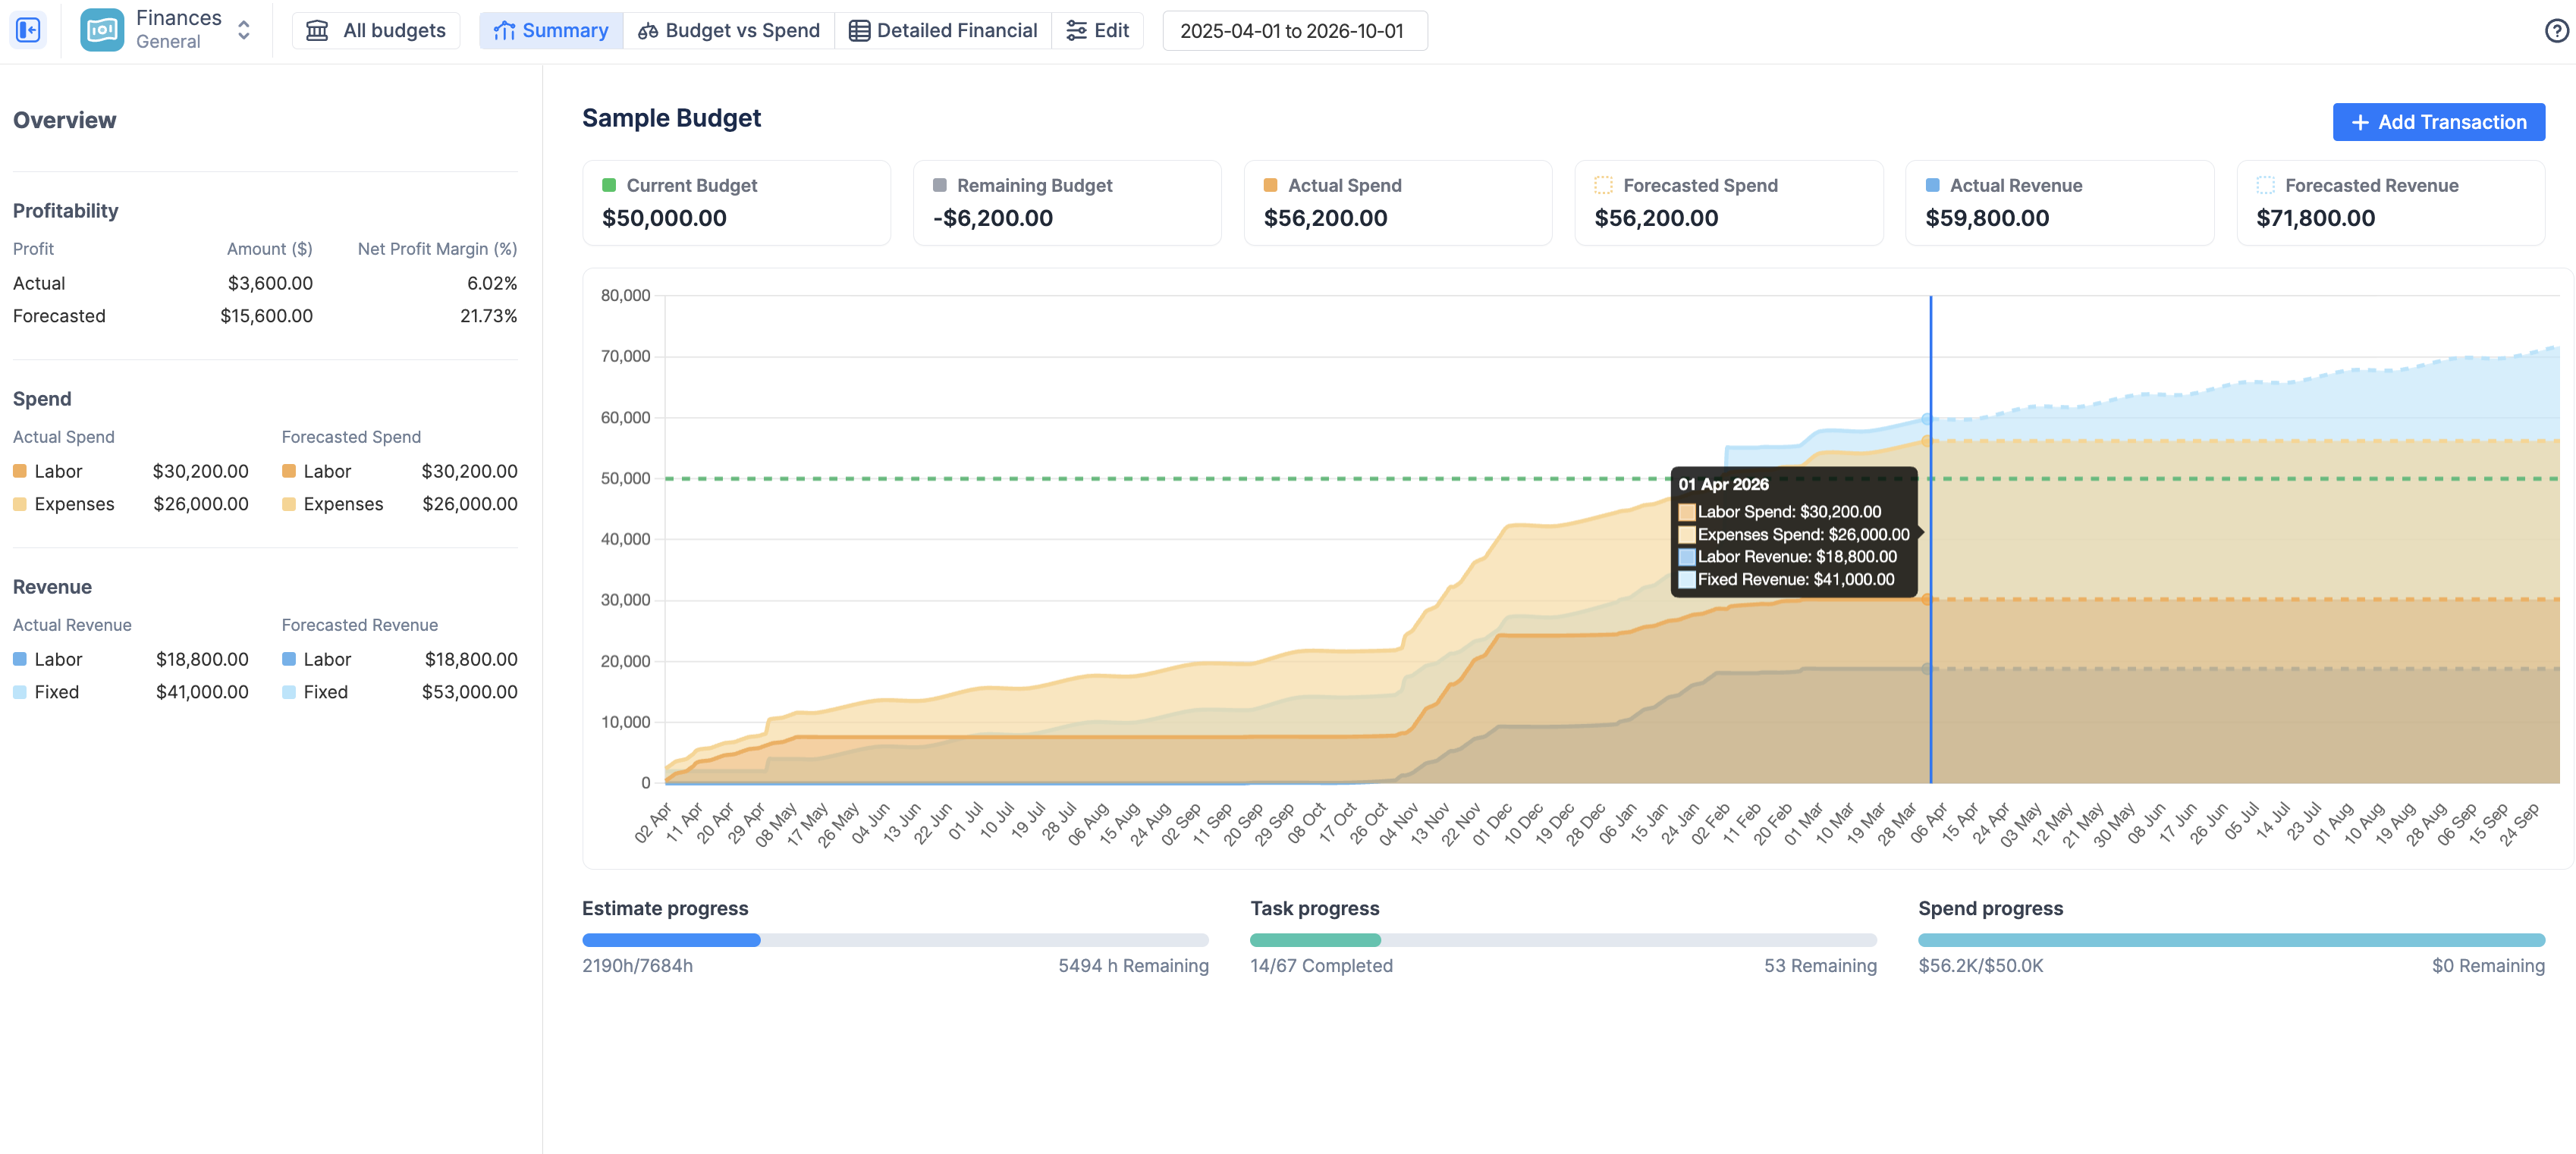
The Summary Dashboard provides an executive-level view of project health.
Key metrics include:
- Current Budget
- Remaining Budget
- Actual Spend
- Forecasted Spend
- Actual Revenue
- Forecasted Revenue
One particularly useful feature is the ability to compare budget consumption with project progress.
For example, if:
- 80% of the budget has been consumed
- only 40% of issues are completed
the dashboard immediately highlights a potential risk before it becomes a major problem.
The cumulative spend and revenue chart also helps teams identify projects that are likely to exceed their budget based on current trends.
Budget vs Spend Report
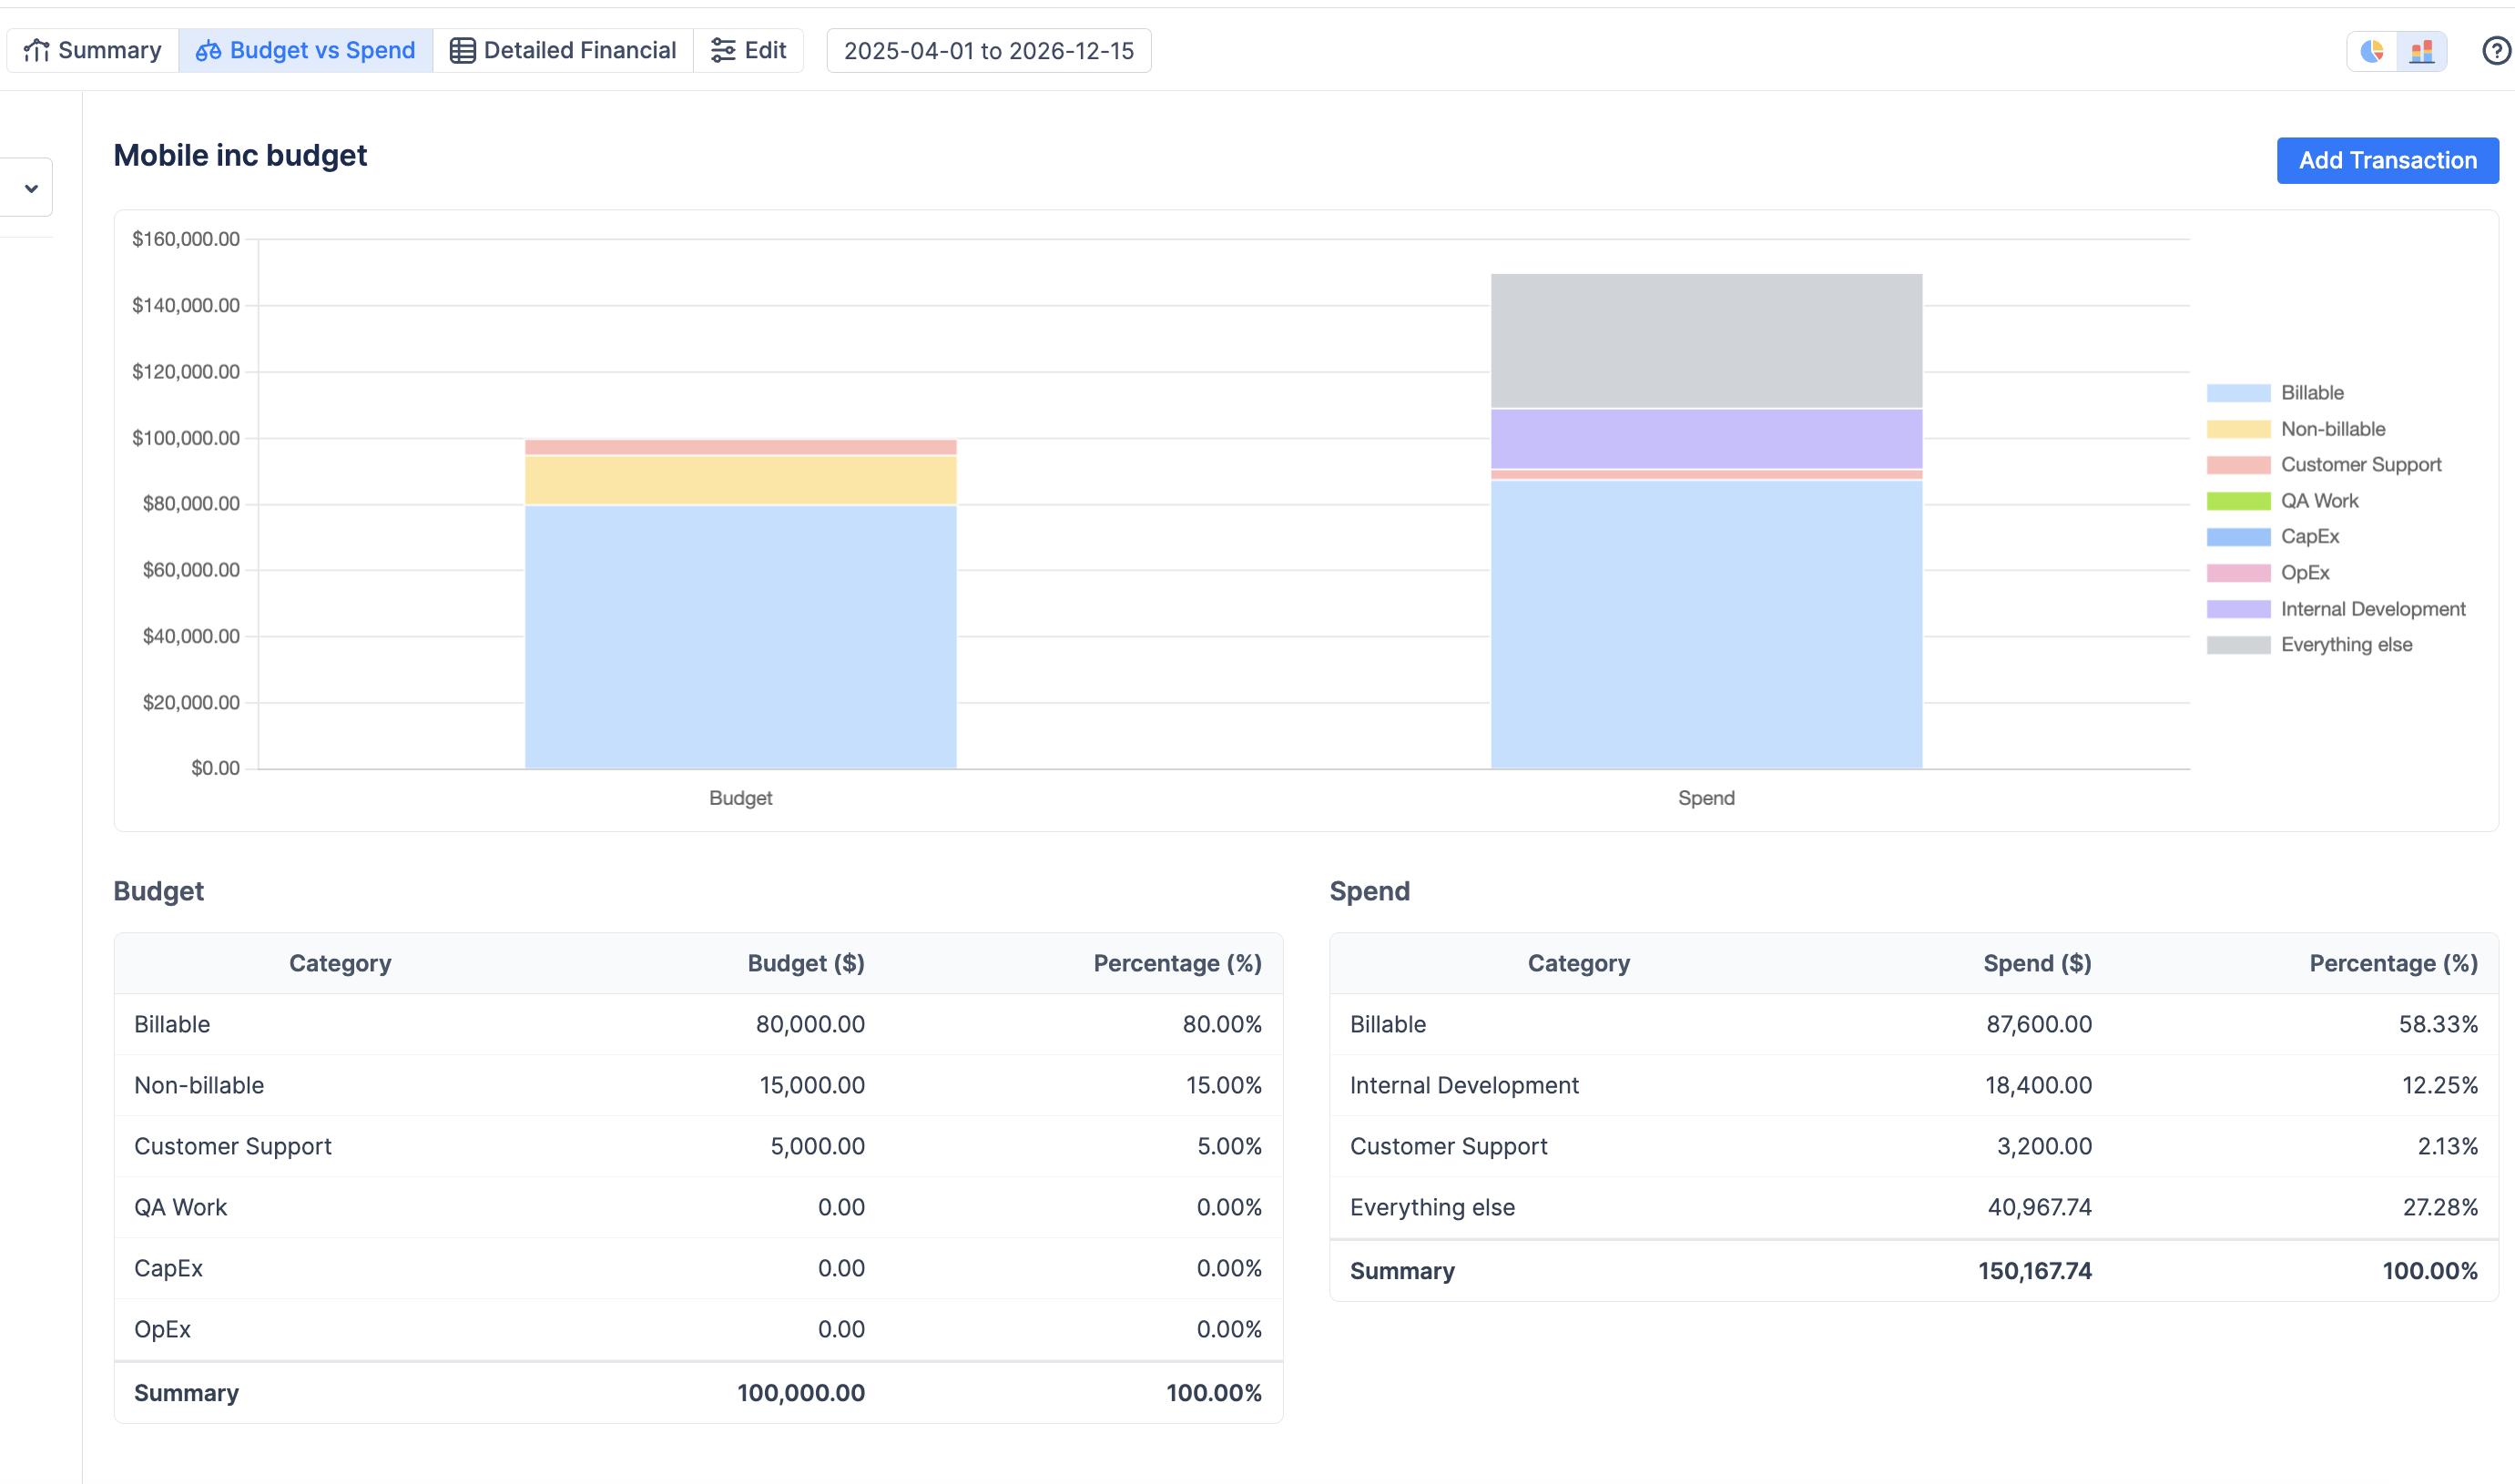
While the Summary Dashboard answers "Are we on track?", the Budget vs Spend report answers:
Are we spending money where we intended to?
Organizations often allocate budgets across:
- teams
- projects
- billable and non-billable work
- departments
The report compares planned allocations against actual spending in real time.
This helps identify budget drift early.
For example, a team may have planned to spend 20% of the budget on internal activities but discovers that internal work is already consuming nearly half of total project costs.
The report supports both proportional and absolute views, making it easier to understand not only where resources are going, but also how much money is actually being spent.
Detailed Financial Report
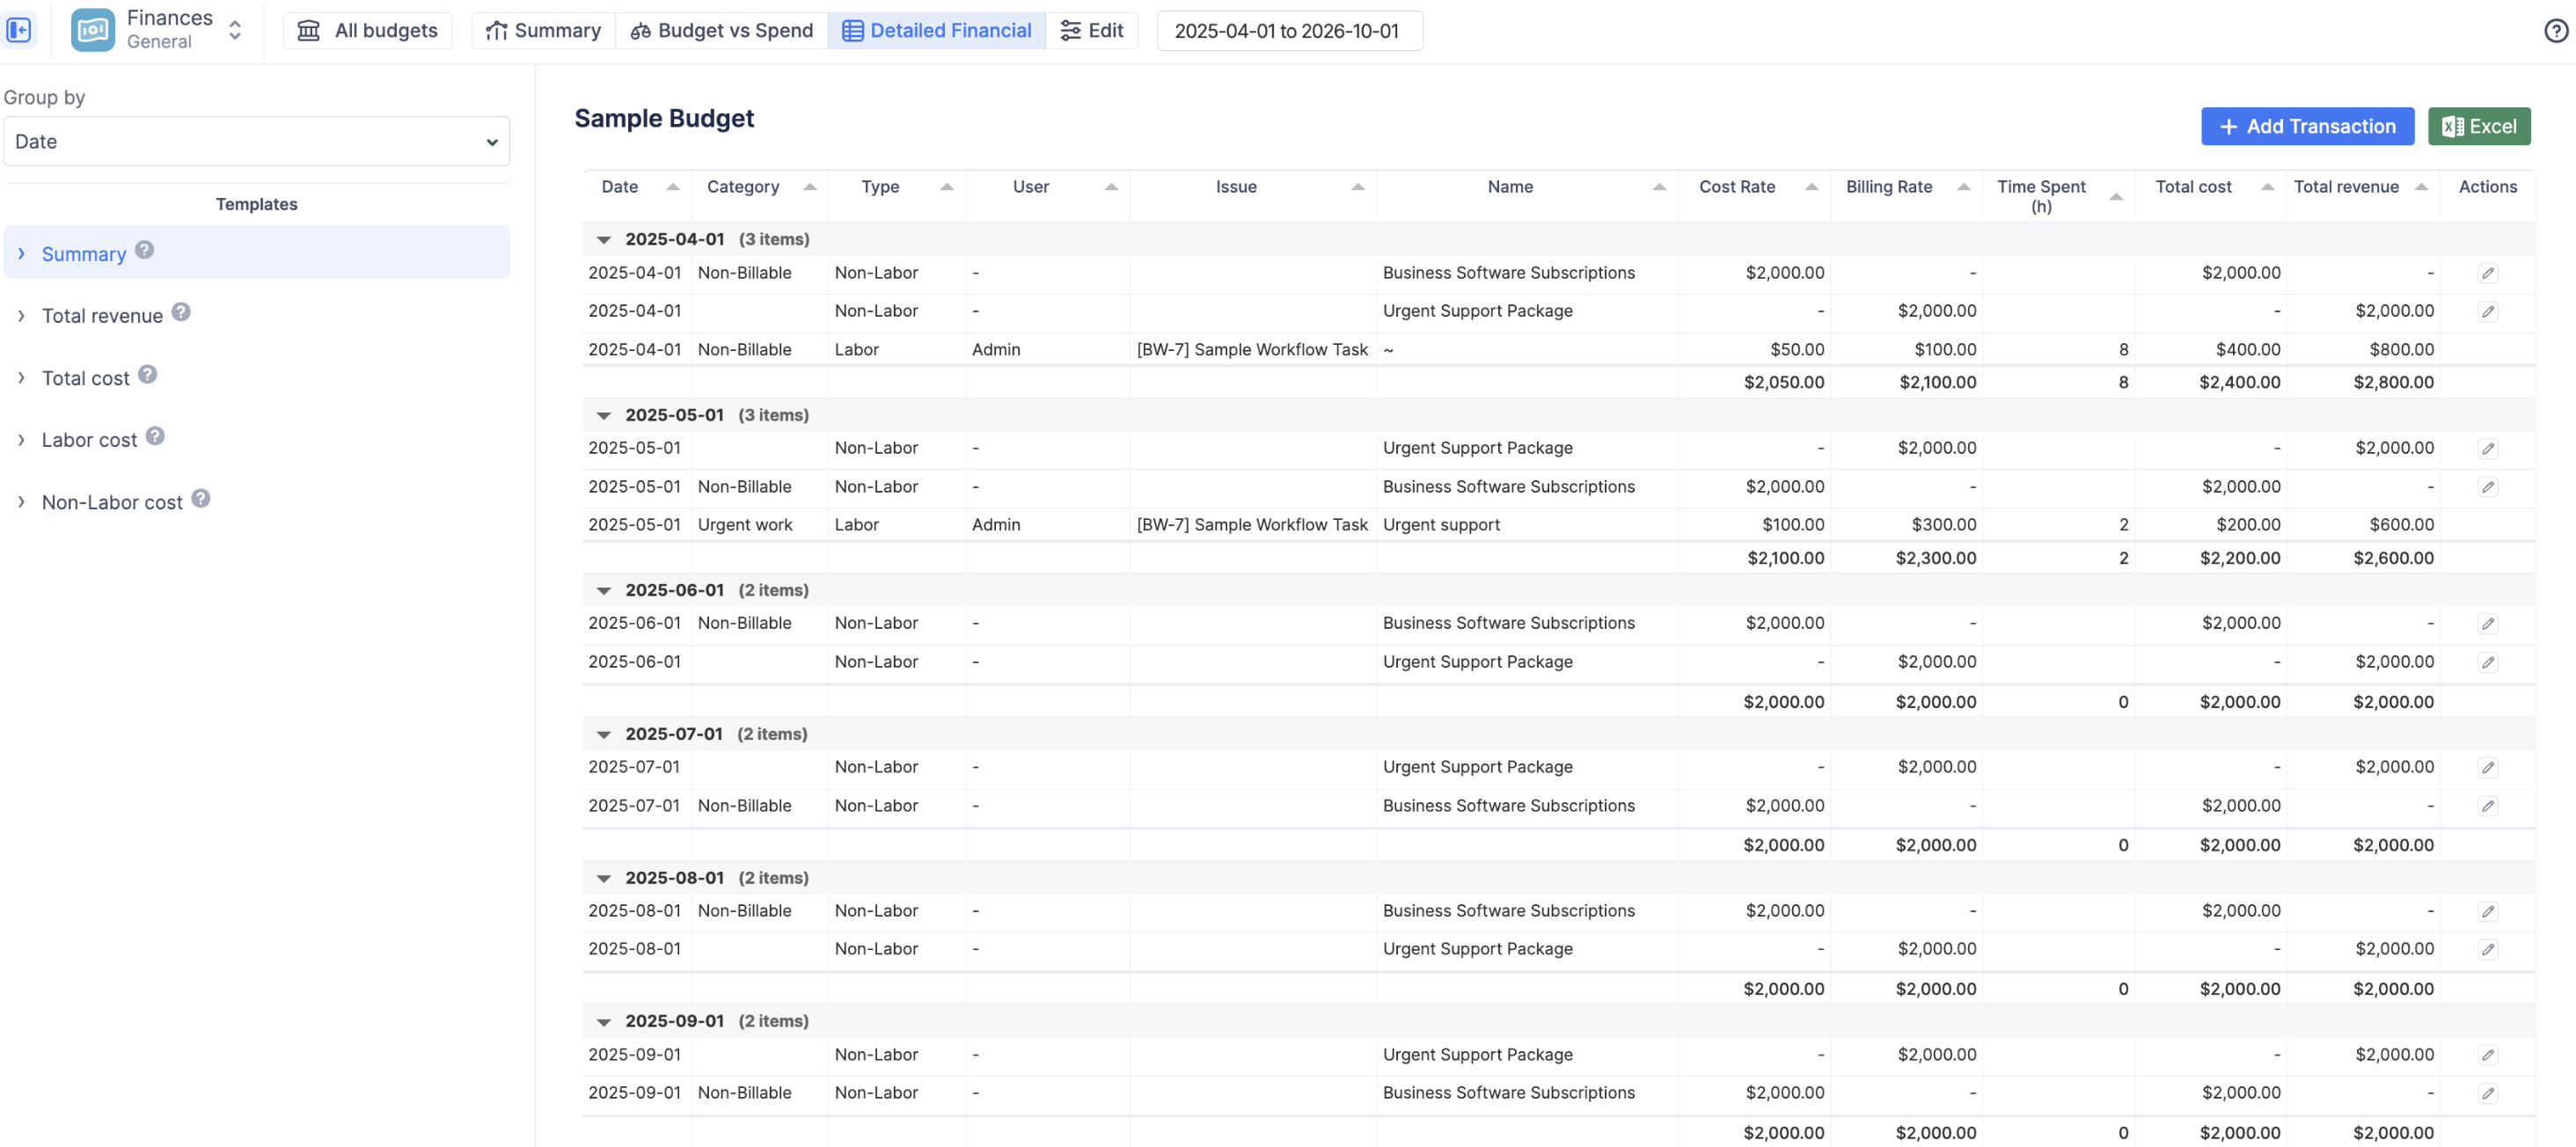
For finance teams that need complete transparency, ActivityTimeline provides a transaction-level ledger.
The report includes:
- individual worklogs
- manual transactions
- applied rates
- calculated costs
- calculated revenue
Teams can group data by:
- Project
- Epic
- User
- Category
and export results directly to Excel for invoicing, auditing, or further analysis.
Several pre-built views are available, including:
- Labor Costs Only
- Non-Labor Costs Only
- Revenue
- Total Profitability
Sharing Financial Reports Securely
Financial visibility often needs to be shared without exposing sensitive salary information.
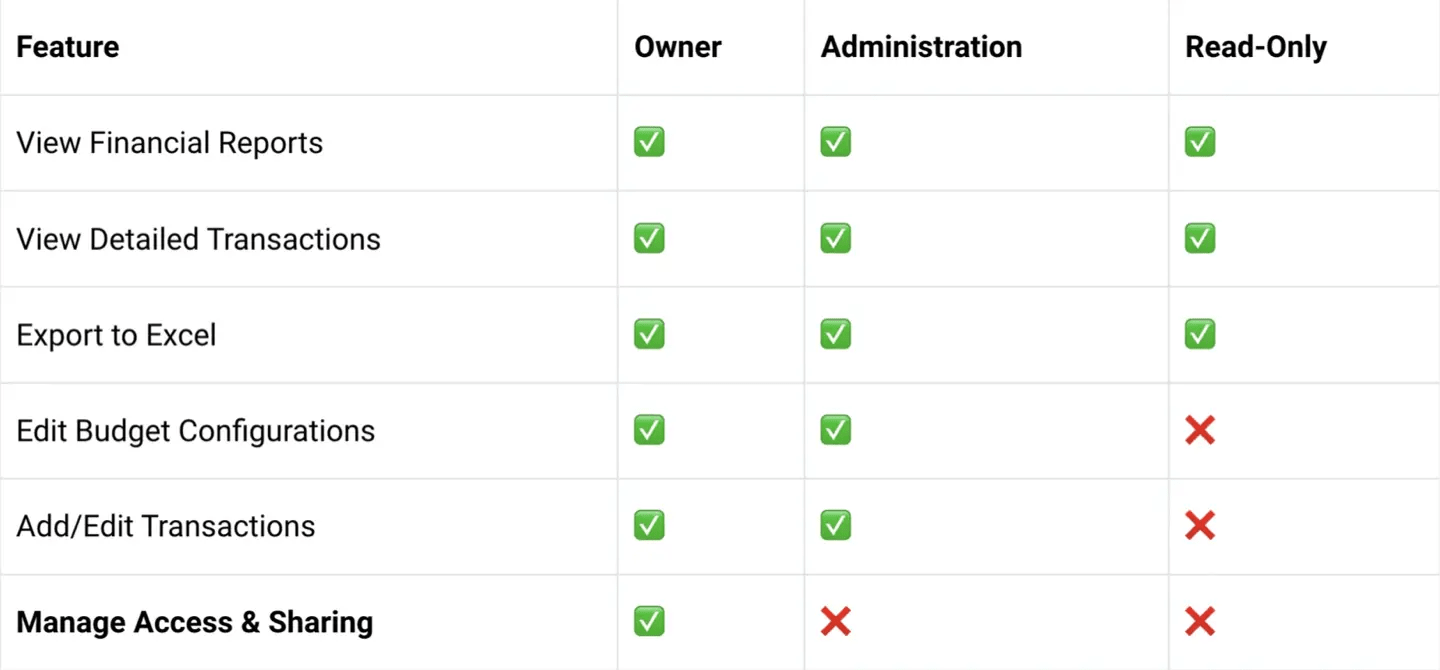
ActivityTimeline addresses this through role-based permissions.
Budgets support:
- Owners
- Administrators
- Read-Only Users
Read-only users can review reports and export data but cannot access labor rate configurations.
In addition, ActivityTimeline respects existing Jira permissions. Users only see financial information associated with Jira projects they already have access to.
This makes it easier to share project financials with stakeholders while keeping compensation data protected.
Typical Use Cases
We've seen teams use the Finances module in several ways:
Consultancies and agencies
- Track project profitability
- Compare labor costs against billable revenue
- Monitor margins throughout delivery
Internal departments
- Control spending against approved budgets
- Monitor operational costs across initiatives
Product organizations
- Understand the true cost of developing and maintaining products
Fixed-price projects
- Track internal costs separately from contract revenue
- Measure project profitability in real time
Final Thoughts
Jira already contains most of the operational data needed for financial reporting.
The challenge is translating logged work into meaningful financial insights.
ActivityTimeline's Finances module extends Jira by connecting worklogs, rates, budgets, and expenses into a unified reporting layer. Instead of exporting data into spreadsheets every month, teams gain real-time visibility into project costs, revenue, budget consumption, and profitability directly within their Jira environment.


