Here's how different teams use the SLA Dashboard Gadget day-to-day — with real examples from the app itself.
A SaaS company's customer support team handles requests across three tiers: Free, Pro, and Enterprise. Enterprise customers have a contractual SLA requiring a first response within 2 hours. The support manager needs a live view to ensure Enterprise tickets are never deprioritised in a busy queue.
They set up two gadgets on the same dashboard: one filtered by customer tier = Enterprise using JQL, and a second showing the overall queue. The real-time SLA status column lets agents self-triage — they can see which Enterprise tickets are approaching their response window without needing a manager to flag them.
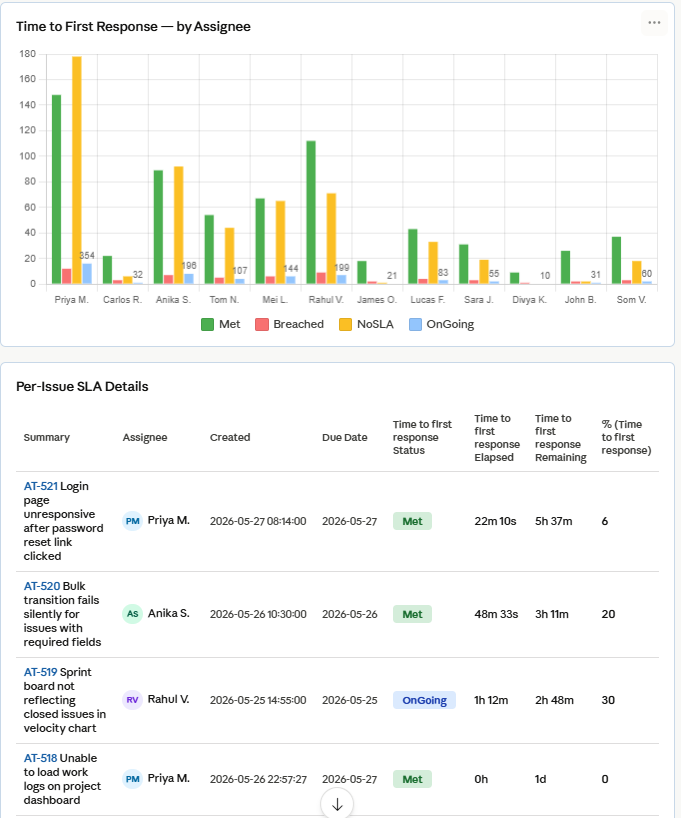
The Time to First Response chart, grouped by assignee, also helps the manager spot if one agent's queue is overloaded before an SLA breach occurs.
Result: Zero missed Enterprise response SLAs in the month after adoption, and faster self-directed prioritisation across the whole team.
Use case 3 - Operations team — preventing SLA breaches during high-volume periods
A managed services provider goes through predictable high-volume periods — Monday mornings, end-of-month billing windows, and product release days — when ticket volume spikes and SLA breaches are most likely. The ops lead needs early warning, not a retrospective report.
Using the gadget's JQL filter, they create a dashboard view scoped to tickets created in the last 24 hours with an open SLA status. During high-volume periods, this dashboard is front-and-centre. The gadget's live SLA counters tick down in real-time, making it obvious when a cluster of tickets all entered the amber zone simultaneously — a signal that a surge is happening and reallocation is needed.
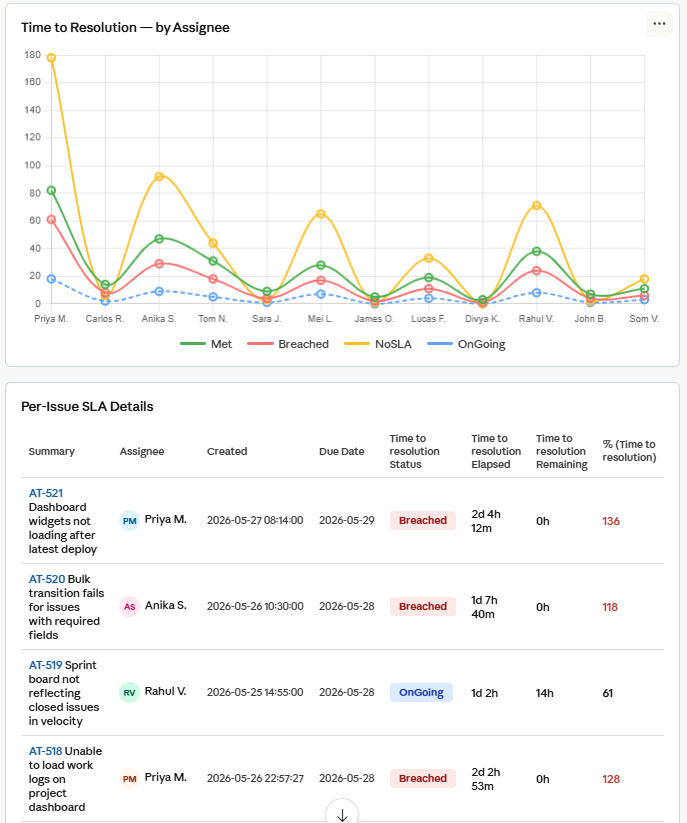
The ops lead also uses the Time to Resolution chart grouped by request type to identify which categories consistently run close to the SLA limit, and feeds that into their staffing model.
Result: The team now proactively reallocates capacity during surges, cutting SLA-breach-related customer escalations in half.
Use case 4 - Engineering team — tracking internal SLAs on bug fixes
Not all SLAs are customer-facing. An engineering team has an internal agreement: Critical bugs must be acknowledged within 1 hour and resolved within 1 business day. These commitments are tracked in Jira Software — not Jira Service Management — and the team previously had no live visibility into whether they were on track.
Because the SLA Dashboard Gadget works with both Jira Software and Jira Service Management, the team adds the gadget to their engineering dashboard, filtered to Bug issue types with Critical or Blocker priority. They extend the table to include the Assignee and Fix Version fields, so the view shows who owns what and which release cycle the fix belongs to.
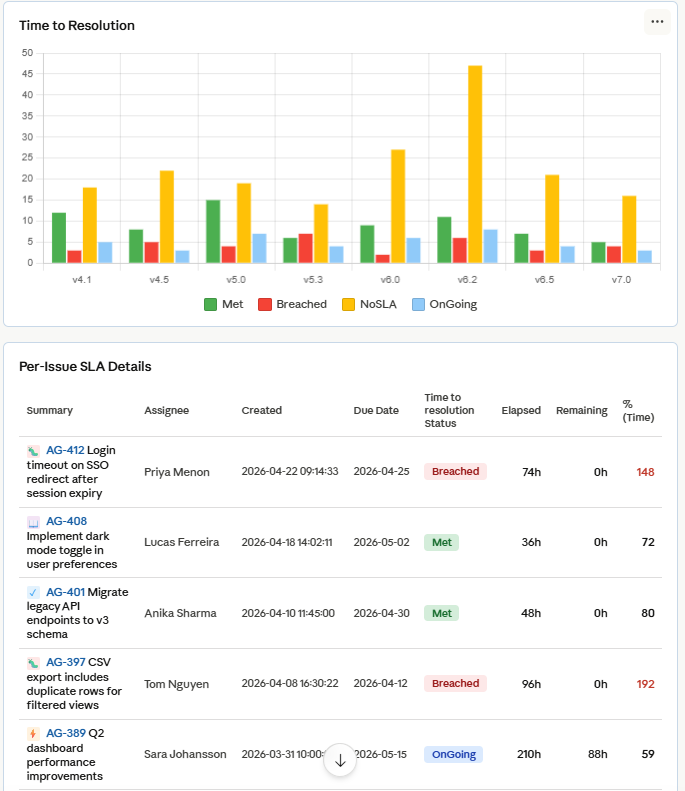
The Time to Resolution chart grouped by fix version gives the engineering lead a clear picture of SLA performance sprint-over-sprint — useful data for retrospectives.
Result: The team achieved consistent SLA compliance on Critical bugs for the first time, and the retrospective chart data led to a revised triage process for Blocker issues.