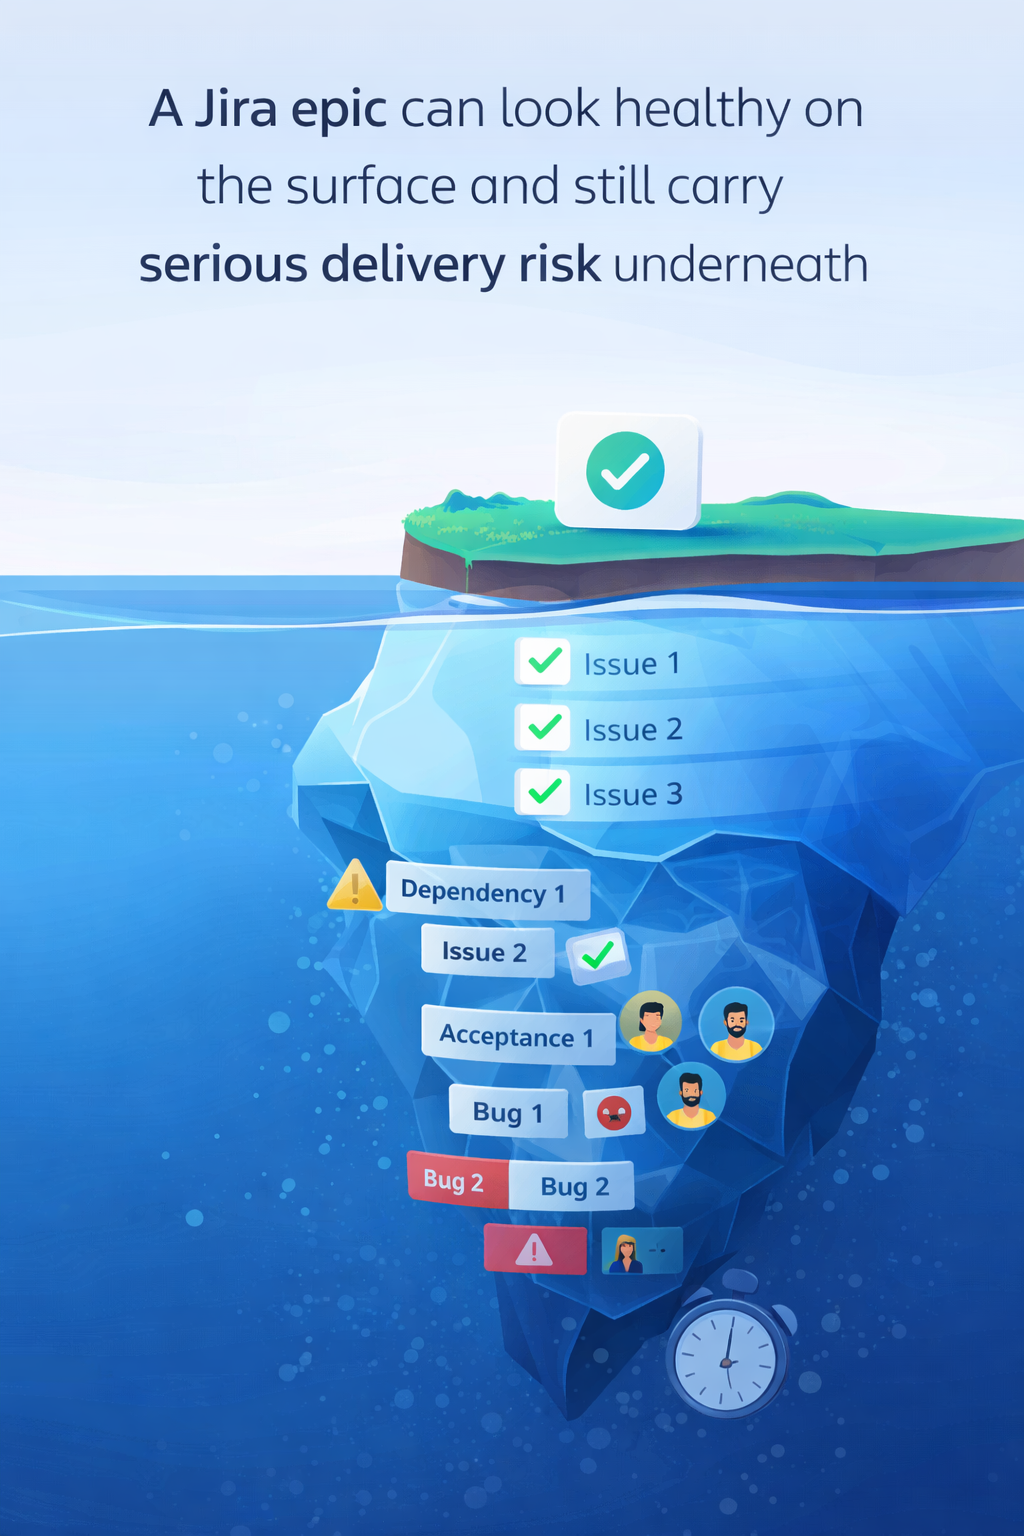
You may see a decent completion percentage, a reasonable number of closed issues, and a sprint that appears to be moving forward. But once you look closer, the picture can change quickly. The remaining work may be concentrated in dependencies, release-readiness tasks, critical bugs, or unowned items that are much more likely to delay delivery than the headline progress number suggests.
That is where TeamlineAI can become genuinely useful.
Not by replacing Jira reports or dashboards, but by helping teams read an epic more like a delivery lead would: across issue status, ownership, due dates, effort signals, work categories, and open risk patterns.
Why % complete is often not enough
A common way to read an epic is to start with issue count.
For example:
-
18 child issues total
-
9 done
-
50% complete
That is a useful starting point, but it is rarely enough to understand real delivery health.
Two epics can both show 50% complete and still be in very different states. One might have mostly straightforward implementation work left. The other might still be carrying unresolved dependencies, rollout tasks, business acceptance work, and production-sensitive bugs.
From a delivery perspective, those are not equivalent.
That is why epic review becomes much more useful when teams look not only at how much work is left, but also at what kind of work is left.
 :
:
A high-level AI-generated epic summary can help surface open work, ownership gaps, and delivery signals that a simple completion percentage does not show
What AI can look at inside a Jira epic
A useful AI-assisted epic review should go beyond summarizing a single issue.
It should be able to work across multiple Jira signals, including:
These signals matter because delivery risk rarely appears in just one field. It usually emerges from the combination of multiple weak signals.
For example:
-
a critical bug with no owner
-
a dependency item that has not moved recently
-
acceptance work that has not started
-
due dates missing from the remaining scope
-
tracked time that does not line up with the estimated effort
Individually, these may look manageable. Together, they can explain why an epic feels slower or riskier than the dashboard suggests.
The first useful layer: a snapshot of epic health
One of the most practical uses of AI here is building a compact epic snapshot.
Instead of making someone manually scan every child issue, the system can summarize the signals that matter most for delivery review, such as:
-
total child issues
-
done vs open work
-
in-progress items
-
blocked or on-hold items
-
overdue open issues
-
assigned vs unassigned work
-
estimate coverage
-
tracked time in a selected period
-
issues with effort overrun
-
age of open work
This makes it much easier to identify whether the epic is still in normal execution mode or whether it is entering a coordination-heavy phase where risk tends to rise.
 A snapshot view helps teams assess epic health quickly by combining progress, planning coverage, effort visibility, and open-risk indicators in one place
Risk is often hidden in the unfinished half
One of the most important delivery insights in epic review is that all open work is not equal.
In the example above, the remaining work is not just “more tasks.” It is weighted toward categories that often create delay late in delivery:
That is why AI can be useful here. It can help distinguish between:
-
work that is still moving normally
-
work that requires coordination
-
work that may block release confidence
-
work that has become risky because it lacks ownership or momentum
This is especially important when an epic appears halfway complete by count, but the remaining half is actually harder to close than the first half.
Grouping work by category makes risk easier to see
One of the clearest ways to surface delivery risk is to break the epic down by work category.
For example:
This makes epic review much more practical.
Instead of asking, “How many issues are left?” teams can ask:
“What kind of work is left, and what does that imply?”
That distinction matters because each category points to a different kind of delivery risk:
-
open implementation work usually suggests capacity risk
-
open dependency work suggests coordination risk
-
open acceptance work suggests signoff or rollout risk
-
open bug work suggests release confidence risk
-
open rework suggests scope stability risk
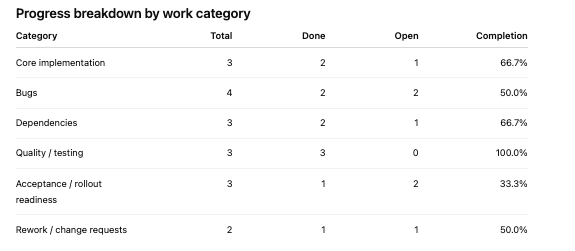
Grouping child issues by work category helps reveal whether the remaining scope is mostly execution work or higher-risk coordination and rollout work
Ownership gaps are one of the strongest warning signs
A very common pattern in Jira epics is that the straightforward work gets closed first, while the harder work remains open:
-
approvals
-
dependency handling
-
UAT
-
rollout coordination
-
edge-case bugs
These items are also the most likely to stall when ownership is weak.
That is why one of the most valuable things AI can do in epic review is highlight questions like:
-
which open issues have no owner?
-
are the highest-risk items assigned?
-
is work actively moving, or just sitting open?
-
does the epic still have execution momentum?
In many cases, weak ownership is a stronger risk signal than low velocity.
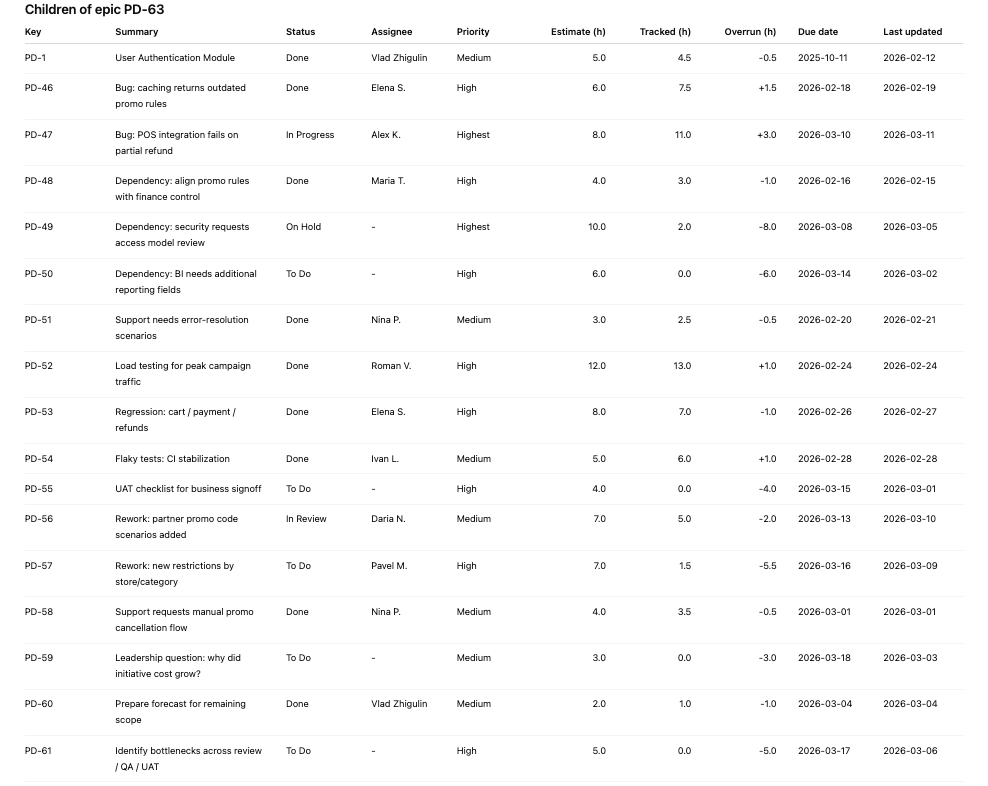
Issue-level visibility helps teams spot which open items have owners, deadlines, and active progress signals - and which ones are more likely to stall
Why this matters for Jira users
Most teams already have access to boards, filters, dashboards, and reports in Jira.
The challenge is usually not lack of data. It is the effort required to interpret that data well, especially when an epic contains mixed work types and multiple delivery signals.
AI can help by reducing that interpretation gap.
Instead of only showing counts or fields, it can help teams form a more useful delivery readout:
That makes epic review more useful for:
A practical framework for reviewing Jira epics with TeamlineAI
A lightweight way to use TeamlineAI in epic review is to check for these signals in order:
-
What is the done vs open distribution?
-
Are there blocked, on-hold, or overdue items?
-
How much of the open work is unassigned?
-
What categories does the remaining work fall into?
-
Are due dates and estimates present on the remaining scope?
-
Is there recent tracked work, or has execution signal gone weak?
-
Are the highest-risk items bugs, dependencies, or acceptance tasks?
-
Which 3–5 issues matter most this week?
This is where AI is most helpful: not in replacing Jira, but in helping teams read Jira more intelligently.
Final thought
A Jira epic can look stable until you look at the composition of the remaining work.
That is why percent complete is only the beginning of epic review, not the conclusion.
Using AI to examine ownership, overdue work, dependencies, effort signals, and work categories can help teams spot delivery risk earlier and have better conversations about what actually needs attention.
How do you usually review delivery risk inside a Jira epic today?
