A burnup chart tracks two things simultaneously: how much work your team has completed and how the total scope has evolved. Unlike a burndown chart, which only shows remaining work, a burnup makes scope changes visible the moment they occur.
Jira's native burnup chart covers the basics, displaying Work Scope, Scope Projection, Completed Work, and an ideal progress Guideline for a single sprint. Useful, but limited.
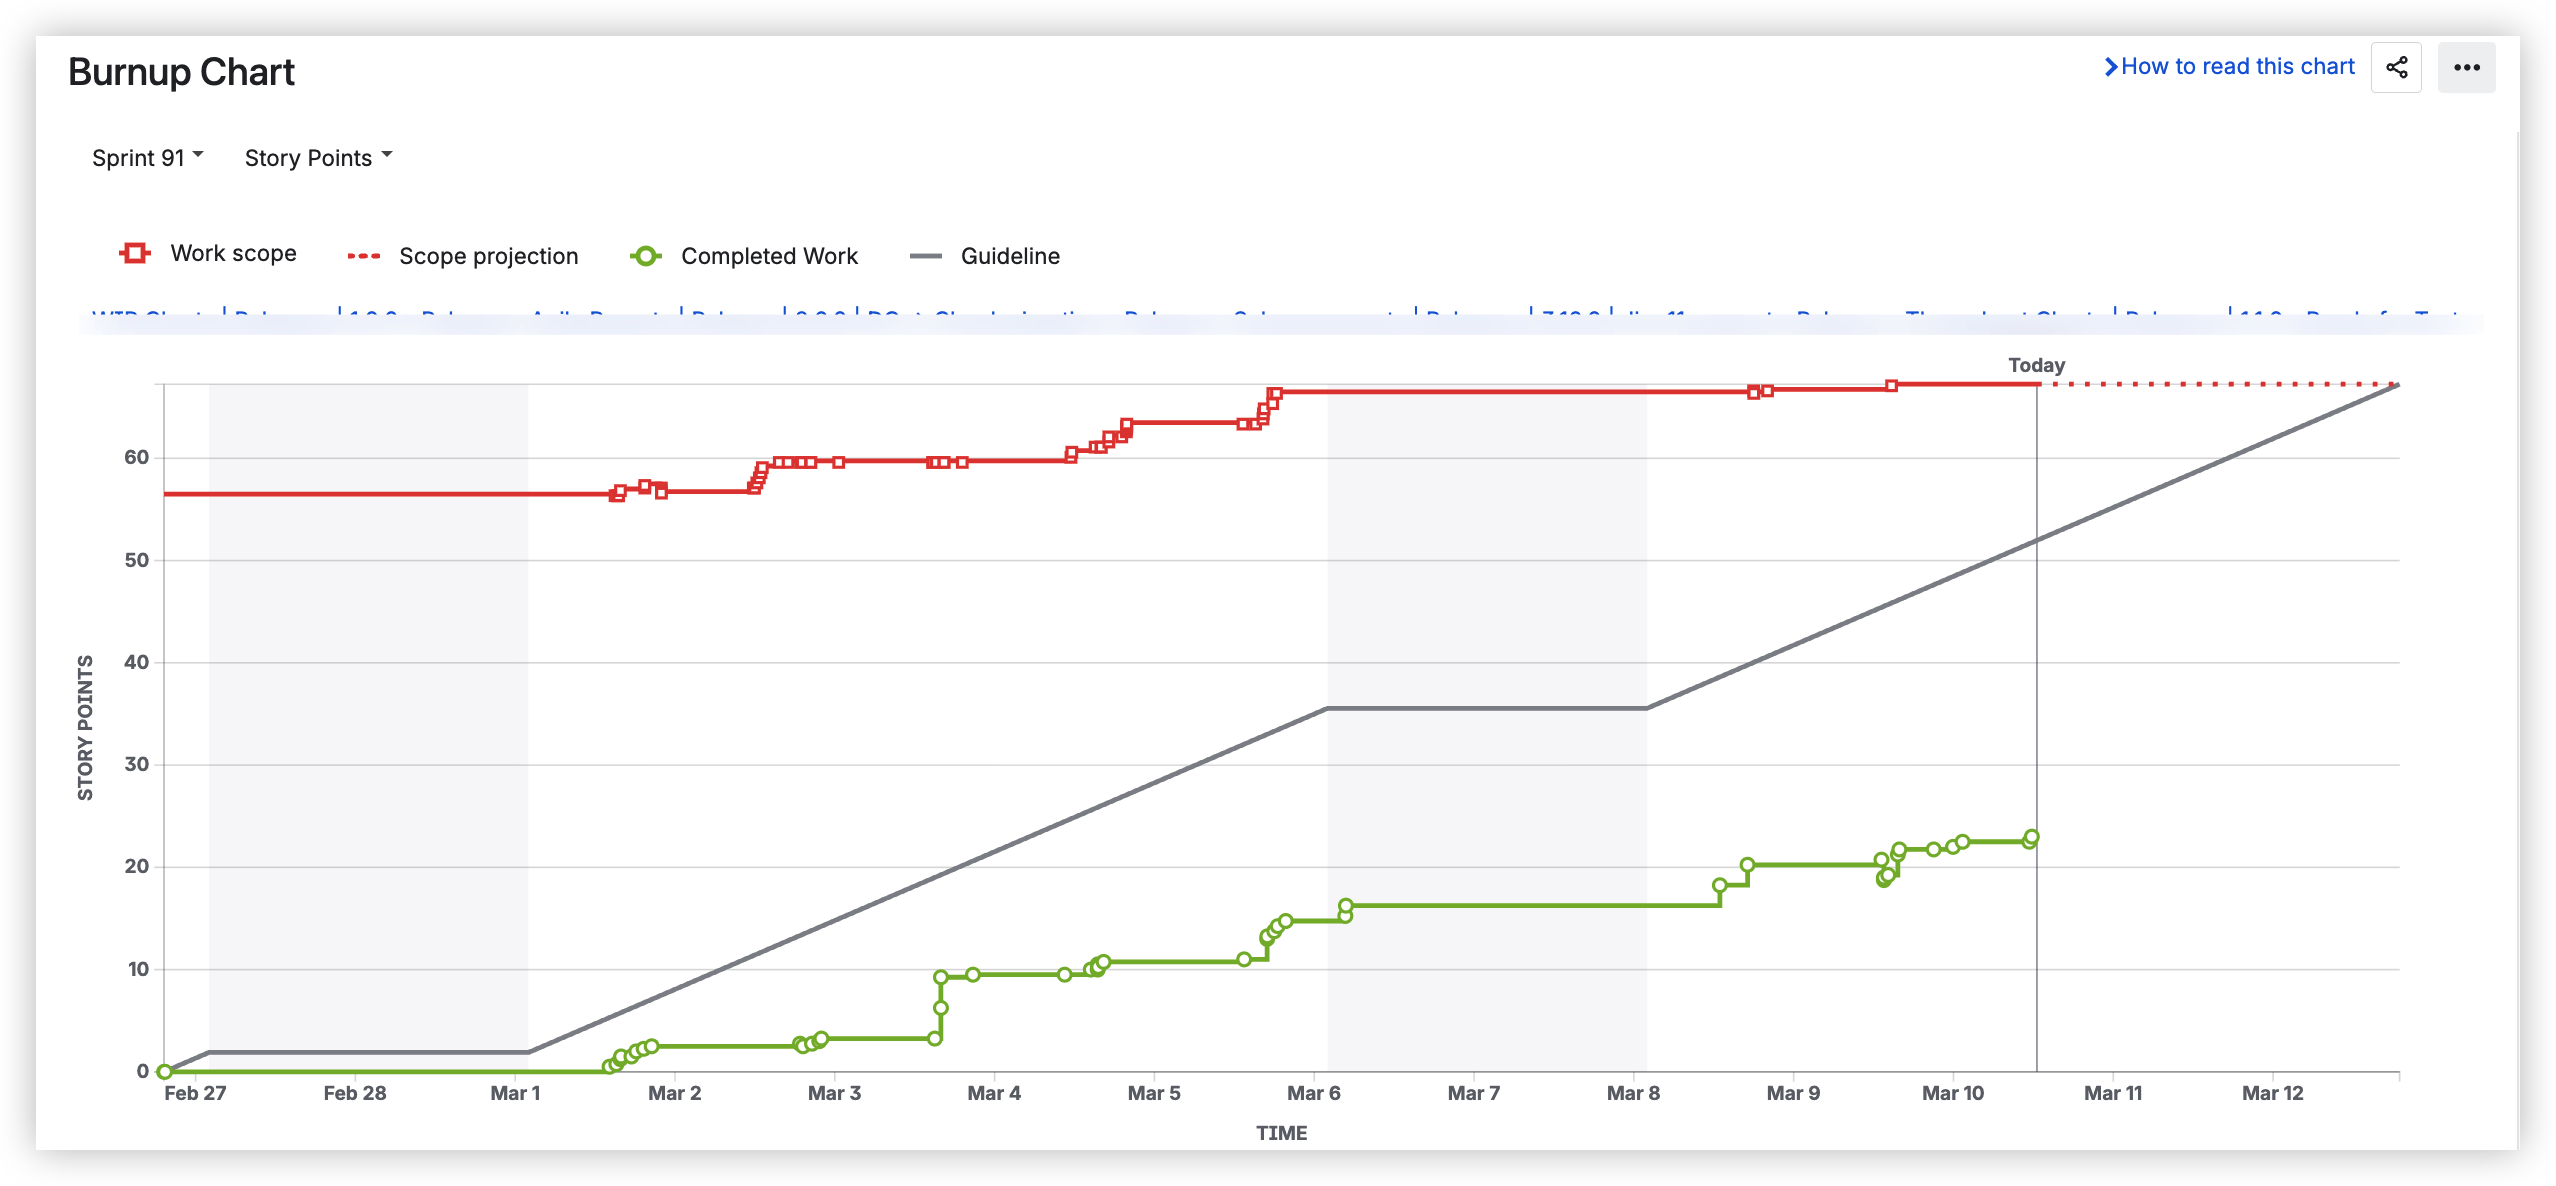
The gap? There's no velocity-based forecasting, no cross-board aggregation, and no support for Kanban burnup views. Teams managing multi-sprint delivery or reporting to stakeholders quickly hit a ceiling and revert to manual spreadsheets.
What's missing from Jira's built-in tools
The core limitation is flexibility. Out of the box, Jira can't:
-
🚫 Aggregate data across multiple boards or teams
-
🚫 Forecast completion based on historical velocity
-
🚫 Model delivery scenarios or simulate scope growth
-
🚫 Switch estimation units between story points, issue count, or time
-
🚫 Support Kanban burnup views in any native form
For anyone managing delivery timelines, coordinating across teams, or presenting to stakeholders, a single-sprint snapshot isn't enough.
How the Agile Burnup Burndown Charts app addresses this
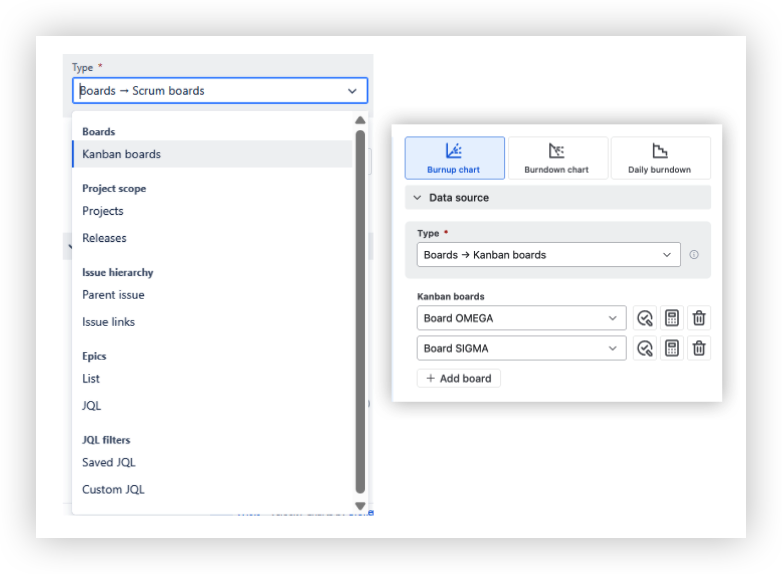
Agile Burnup Burndown Charts by Broken Build is a Jira dashboard gadget built specifically to close these gaps. What sets it apart is its support for multiple data sources: Scrum boards, Kanban boards, projects, releases, epics, initiatives, and custom JQL queries. It adapts to how your team actually works, rather than forcing a single framework.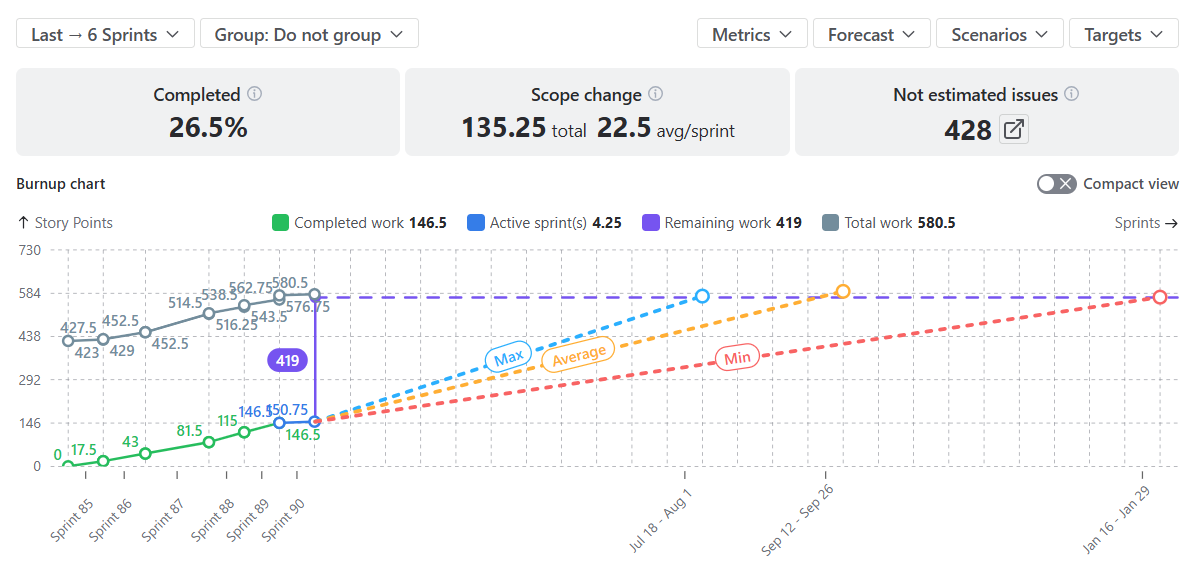
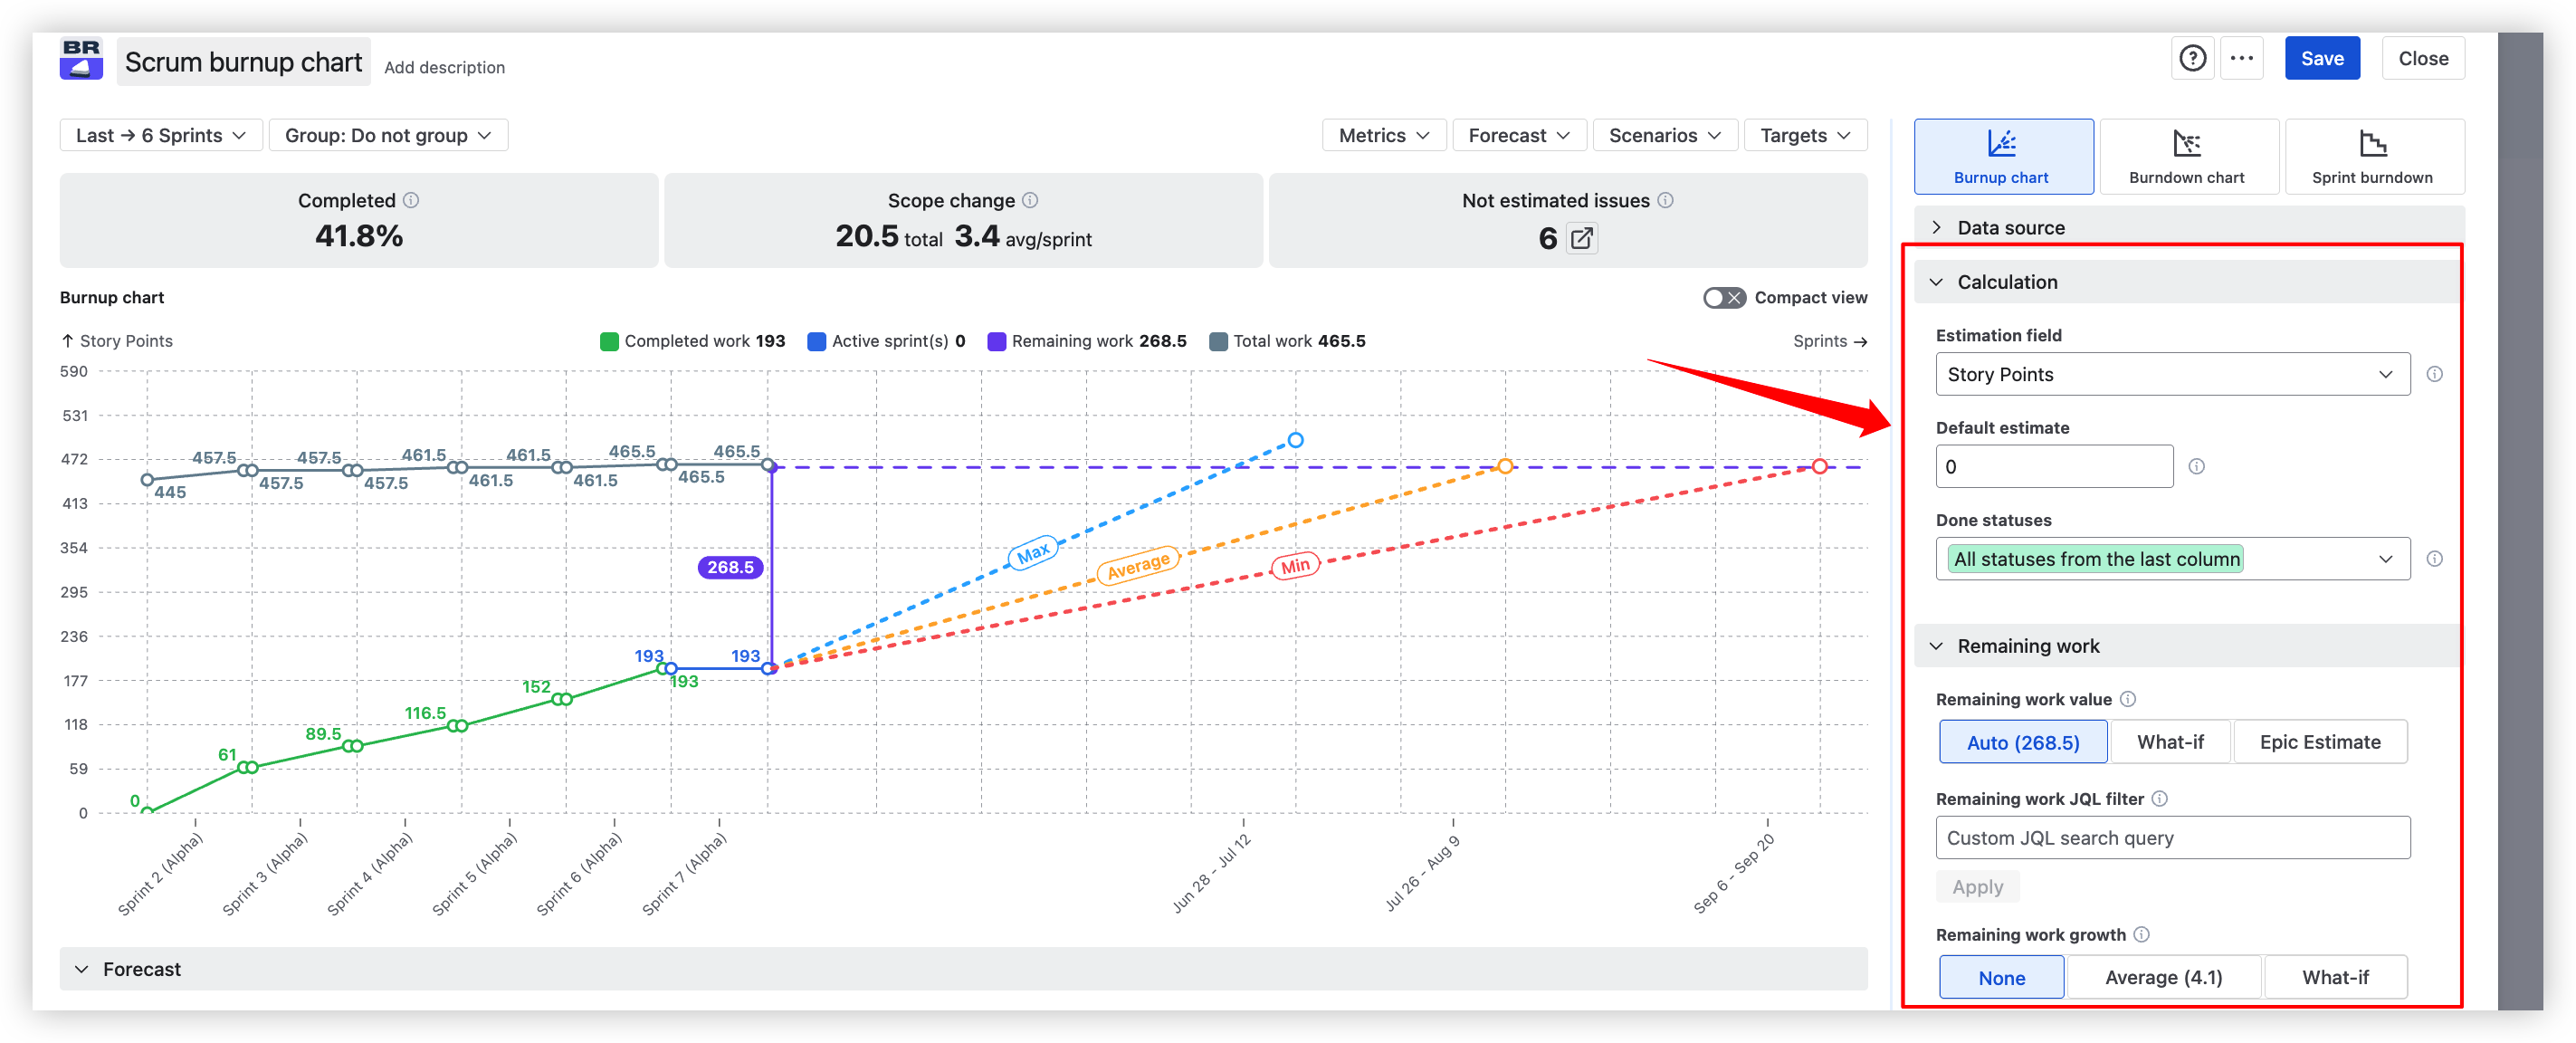
The chart plots completed work against the total scope over time. At a glance, you can see story points delivered, the percentage of scope complete, and how much work remains - all configurable by time range, estimation field, and data source.
Key features of the Jira Burnup chart by Broken Build
📊 Velocity-based forecasting
The chart automatically generates three forecast projections from your team's historical velocity data:
-
🟦 Max - Delivery at the highest recorded pace
-
🟧 Average - Mean velocity across the configured period
-
🟥 Min - Most conservative projection based on the slowest pace
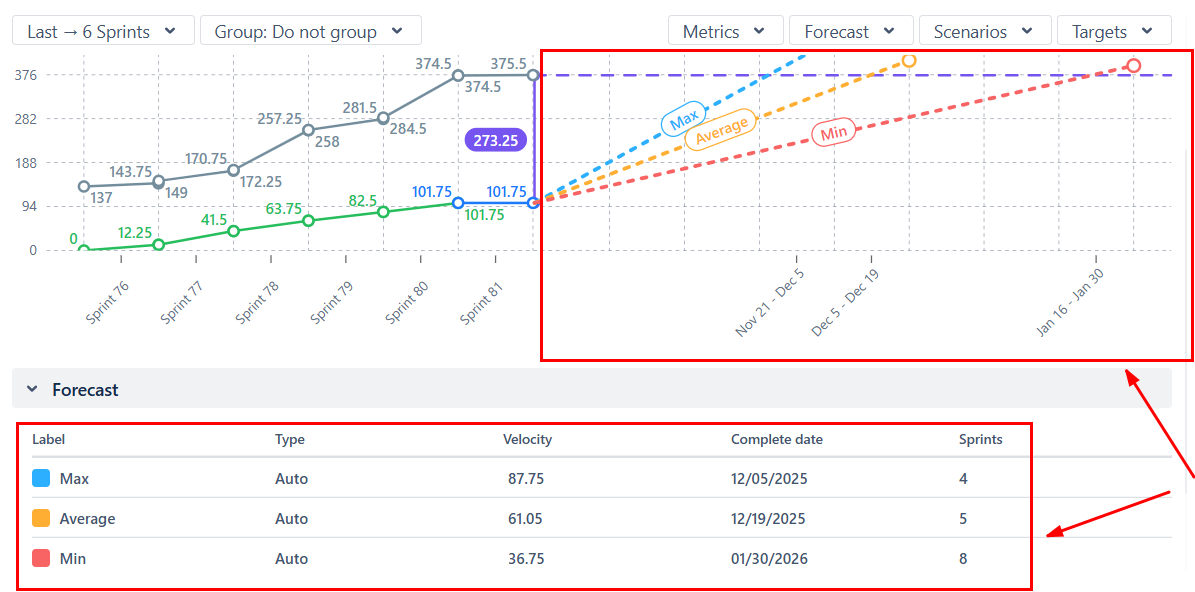
Each scenario displays an estimated completion date and the number of sprints or intervals remaining, giving stakeholders a defensible range rather than a single optimistic estimate.
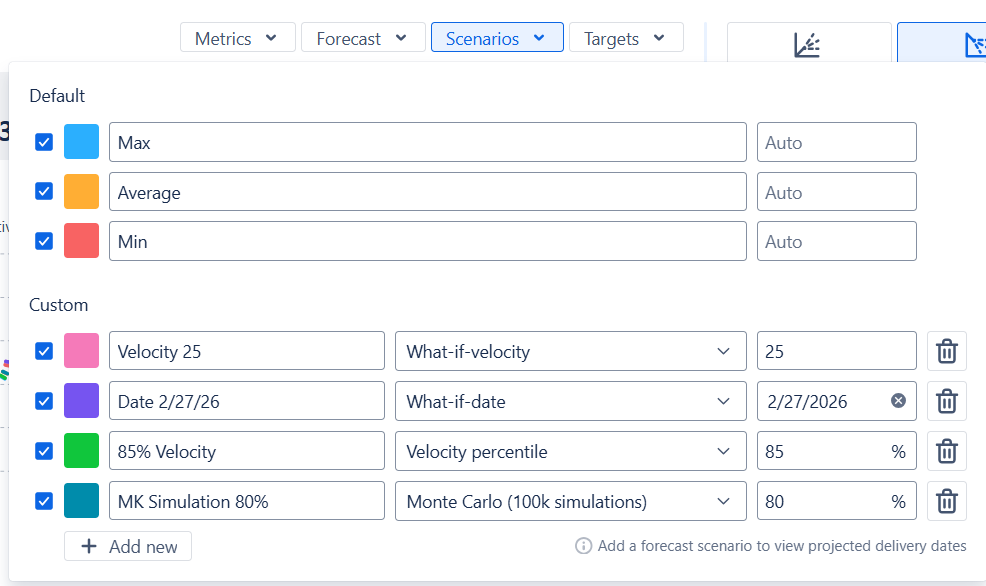
Beyond defaults, you can build custom scenarios using a target velocity, a fixed deadline, a velocity percentile, or a Monte Carlo simulation. This lets you model specific planning questions, such as "What if we deliver 20% faster?" or "Can we realistically hit this release date?"
🔧 Scope modelling and estimation flexibility
🗂️ Multi-board and cross-team support
Select multiple Scrum or Kanban boards to aggregate delivery data across teams. Sprint name filters, issue type filters, and JQL-based scoping let you shape the chart to reflect exactly the work you're tracking - from one team's sprint to an entire PI.
🔍 Issue-level drill-down
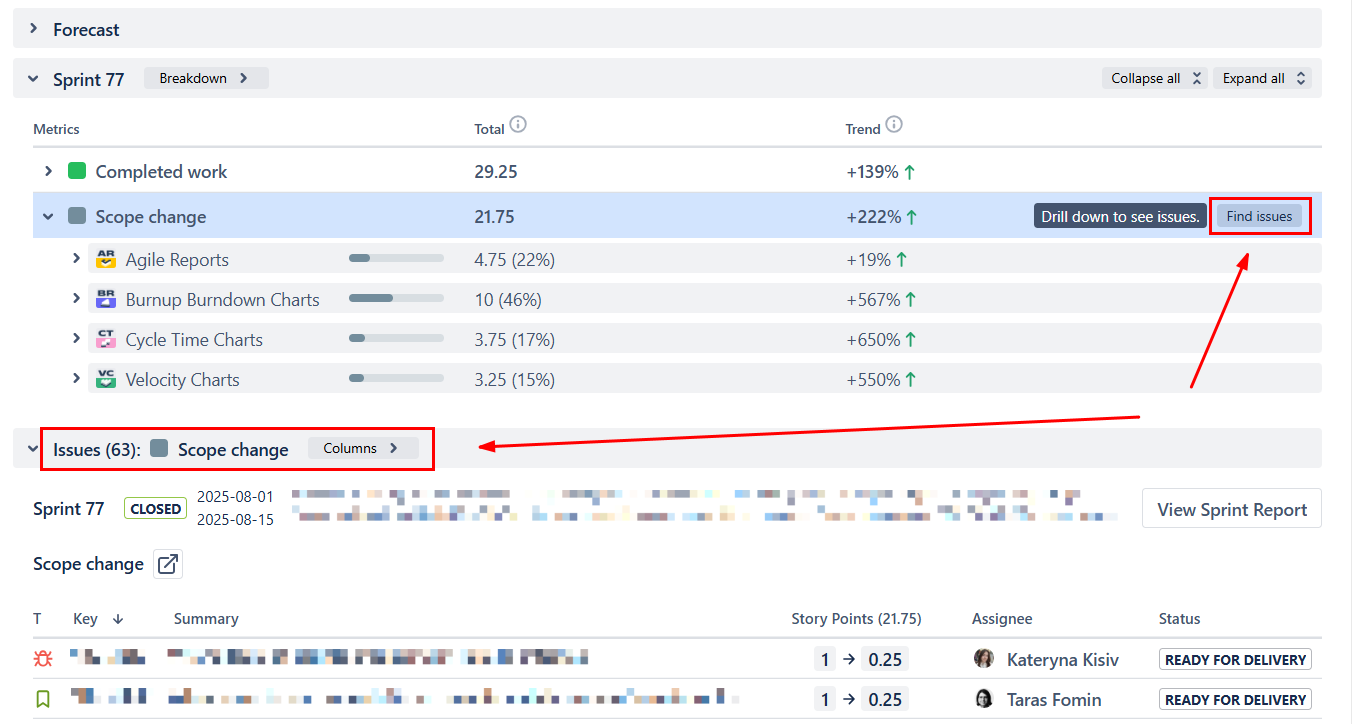
Click on any data point to see exactly which issues contribute to the count at that moment. No guesswork, no context-switching.
Ready to try it? If your team has hit the ceiling of Jira's native burnup report, the Agile Burnup Burndown Charts app is available now on the Atlassian Marketplace - free to install and try.
Need broader reporting capabilities?
If your teams also require velocity trends, cycle time analysis, cumulative flow diagrams, or Monte Carlo simulations, the Agile Reports & Gadgets bundle includes all charting apps - including burnup and burndown charts - under a single licence.
The outcome: planning conversations grounded in real data
With a properly configured Jira burnup chart using the Agile Burnup Burndown Charts app by Broken Build, teams stop guessing and start planning from evidence:
-
✅ Scope changes are visible the moment they happen
-
✅ Forecasts are grounded in actual velocity - not optimism
-
✅ Stakeholders get transparent, range-based timelines
-
✅ Both Scrum and Kanban teams are fully supported
Pro tip: Use the multi-scenario forecast view in your sprint review or release planning sessions. Showing stakeholders best-, average-, and worst-case projections builds far more trust than committing to a single date.
💬 Contact Broken Build support for setup help, best-practice guidance, or advanced use cases
Support options:
- 🔗 Customer Portal
- 📅 Book a demo
Happy reporting,
The Broken Build Team
