We have all witnessed it. A high-priority project is behind schedule. The stakeholders are getting restless. In a moment of panic, management reaches for the trusty lever: “Hire more developers.”
It makes perfect sense. More developers mean more hands on deck. The project will get done faster, right?
But weeks later, the project is even further behind schedule. This is famously known as Brooks’ Law: “Adding manpower to a late software project makes it later.” But why does this happen, and what can be done instead?
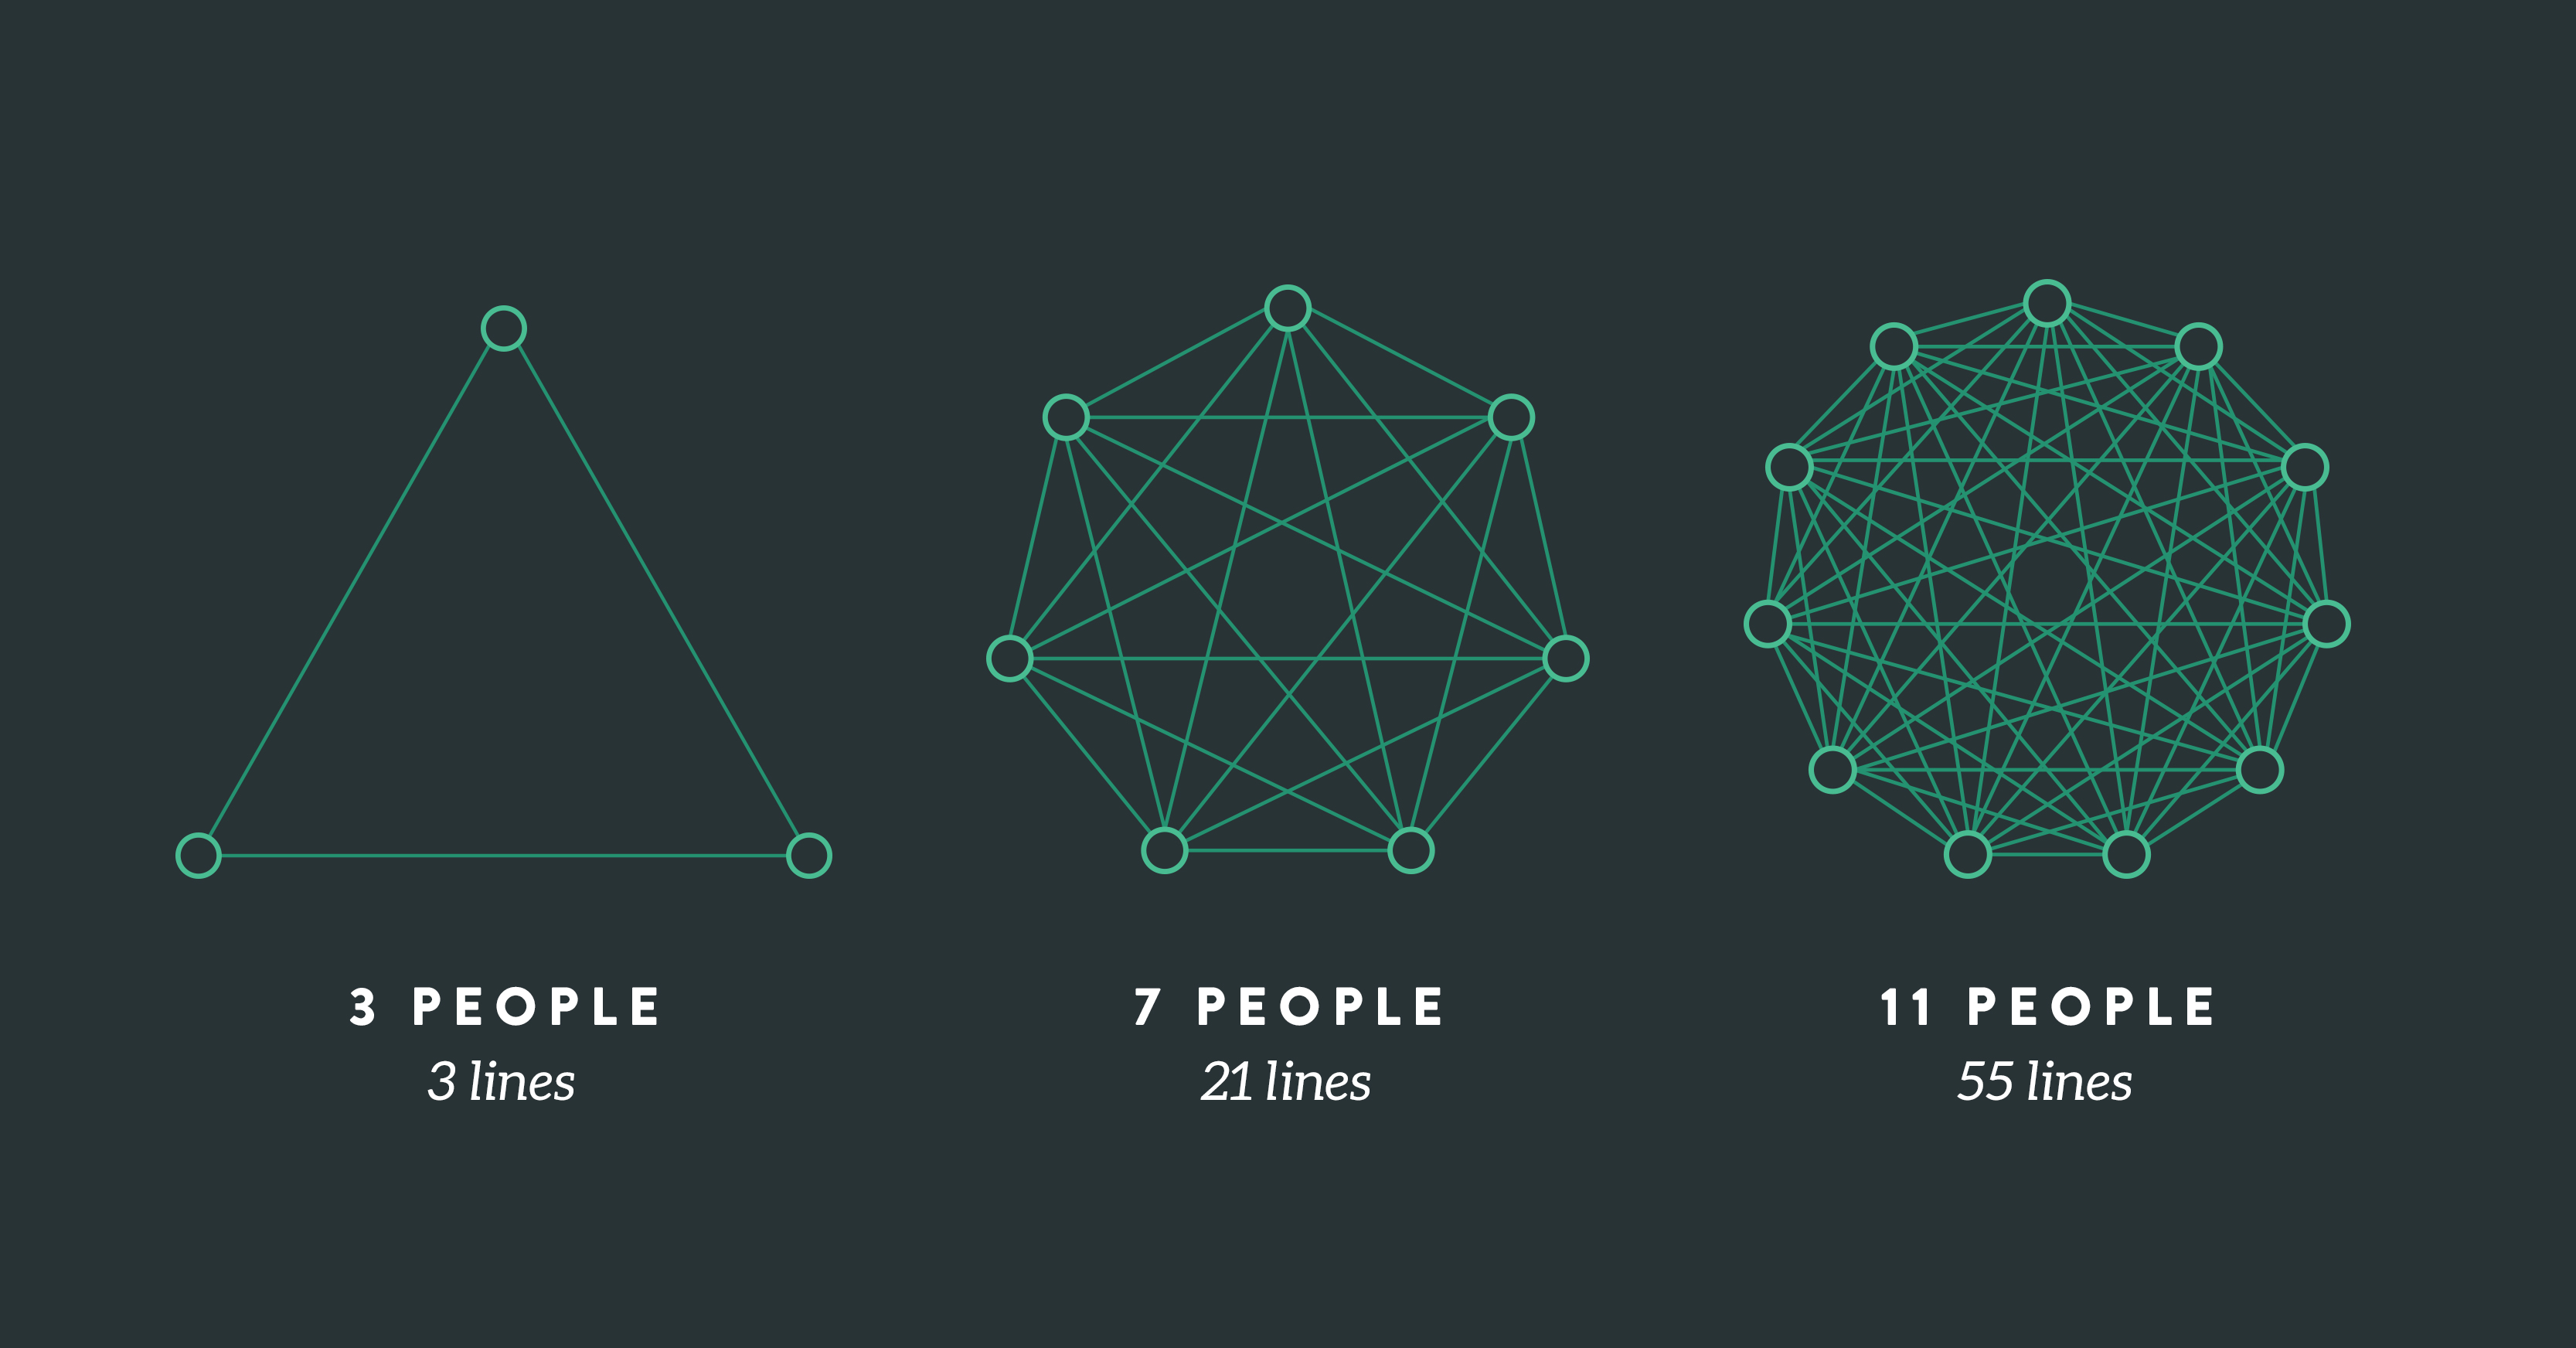
The Insight: It’s Not About Hands, It’s About Queues
According to the Flow Framework, the primary reason for delay in modern software delivery isn't a lack of coding capacity; it is queues.
Studies suggest that in many workflows, value-generating work (active coding, designing, writing) accounts for only a small fraction of the total cycle time. For the other 80% of the time, the task is simply sitting in a queue—waiting for code review, waiting for QA, waiting for deployment, or waiting for clarification.
If your current process is bottlenecked by these "Wait Times," adding more developers doesn't clear the jam. In fact, it adds more tasks to the backlog, creating more noise, more communication overhead, and longer queues.
The Solution: Visualize the Hidden Queues
To solve the paradox, you don't need to inflate your staff; you need to optimize your process. But you cannot optimize what you cannot see.
This is where the application Time Metrics Tracker comes in. It helps teams visualize "hidden queues" by accurately tracking Wait Time.
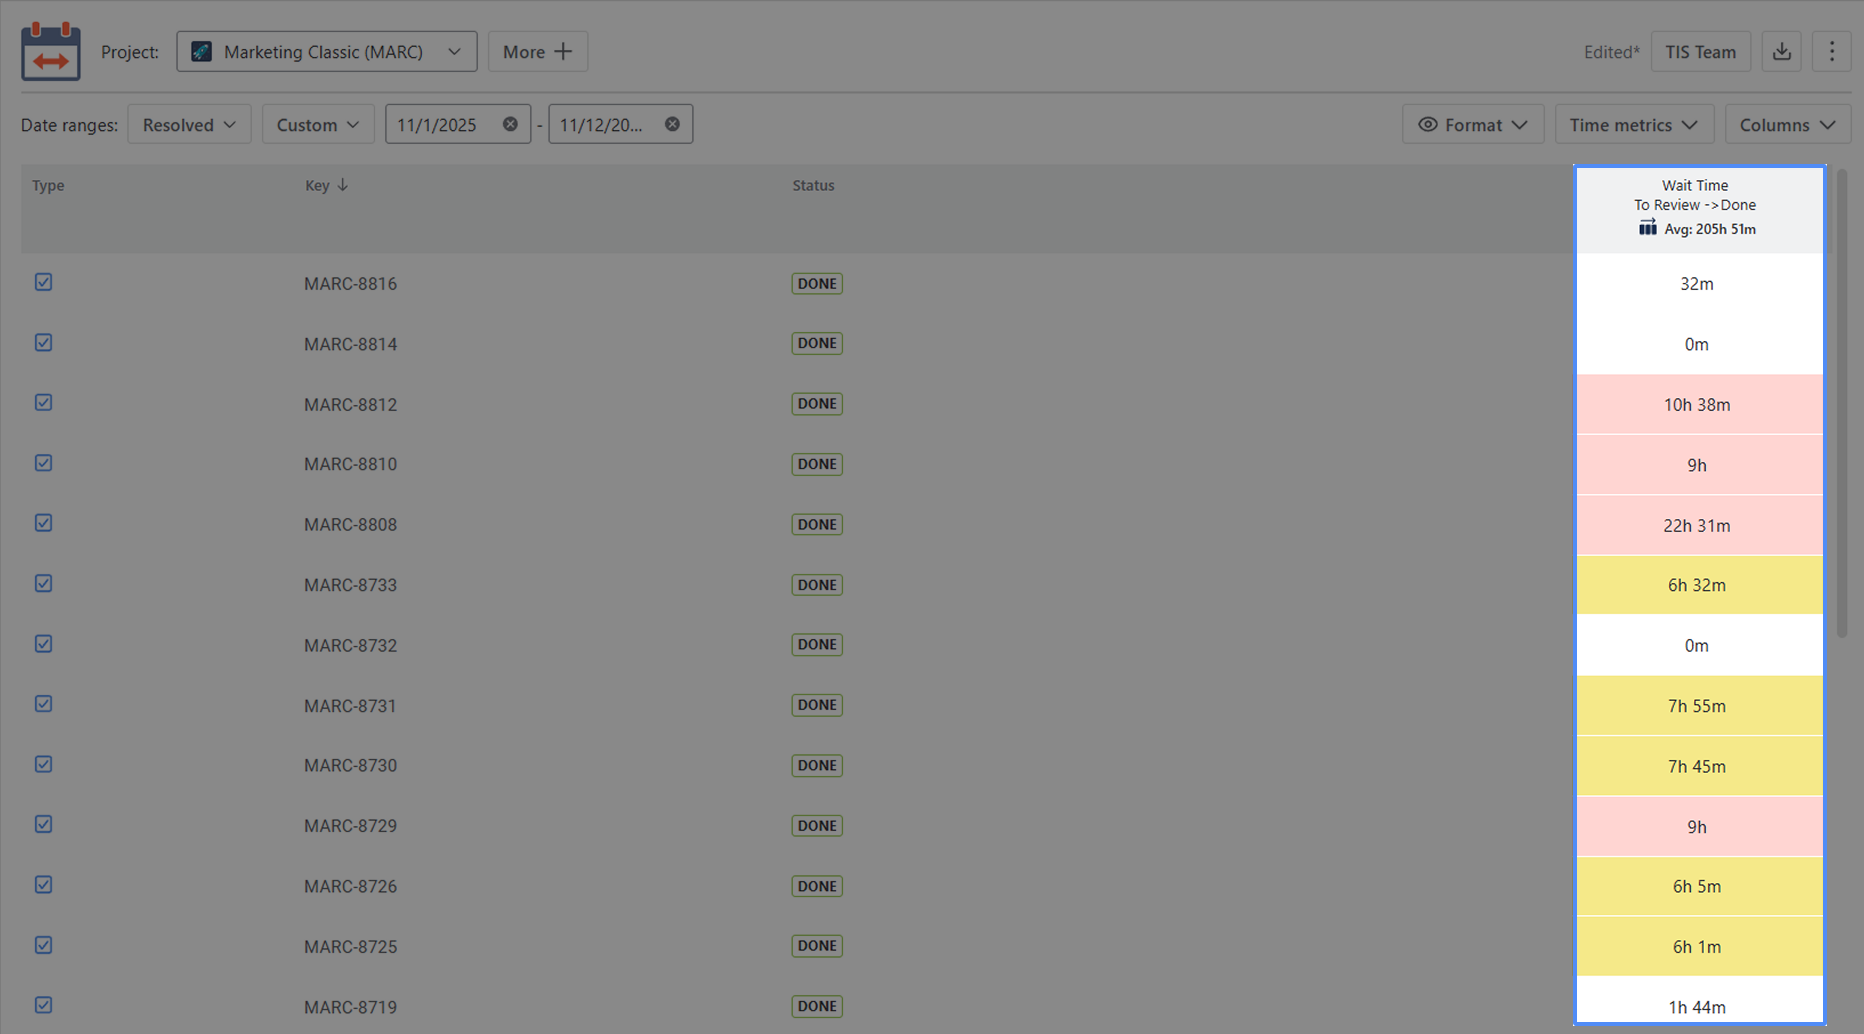
Below is a guide on how to shift your focus from "hiring" to "flowing" by tracking wait times in Jira.
📝 Guide to Tracking Wait Time in Jira
Context: Your team is dealing with bottlenecks. Tasks are piling up in status columns like "In Review" or "Ready for QA," but you lack the data to prove exactly how much time is being wasted there.
🤔 The User Problem
Without proper tracking, it is hard to pinpoint where delays happen. Is the bottleneck in the design phase? Or is it the approval process? Wait Time refers to the period during which a task is idle. Reducing this metric is the fastest, cheapest way to speed up time-to-market.
💡 The Solution
Time Metrics Tracker allows you to measure these specific durations between statuses. Here is how to configure it to expose your bottlenecks.
How to Configure Wait Time Metrics
There are two easy ways to set this up within the app.
Method 1: The Configuration Menu
This is best for modifying existing status groups or setting up global metrics.
- Navigate to the Time Metrics Tracker section.
- Click the Configuration button (found in the top-right corner menu ⋯ or in the left sidebar navigation).
- Click + Time metric.
Method 2: On the Grid
You can create metrics directly while viewing your data table.
- Click the Time Metrics button in the upper-right corner of the table.
- Define your Conditions:
- Start Status: Select the status where the queue begins (e.g., Waiting for Approval).
- Stop Status: Select the status where work resumes (e.g., In Progress).
- Pause Status: (Optional) Select statuses where the timer should stop (e.g., On Hold).
- Refine Transitions: You can select the "first transition to" or "last transition from" a status to handle tickets that move back and forth multiple times.
- Set Limits: Optionally, set Warning and Critical time limits. This will highlight tasks that have been sitting in a queue for too long (e.g., red flag if a ticket waits > 48 hours).
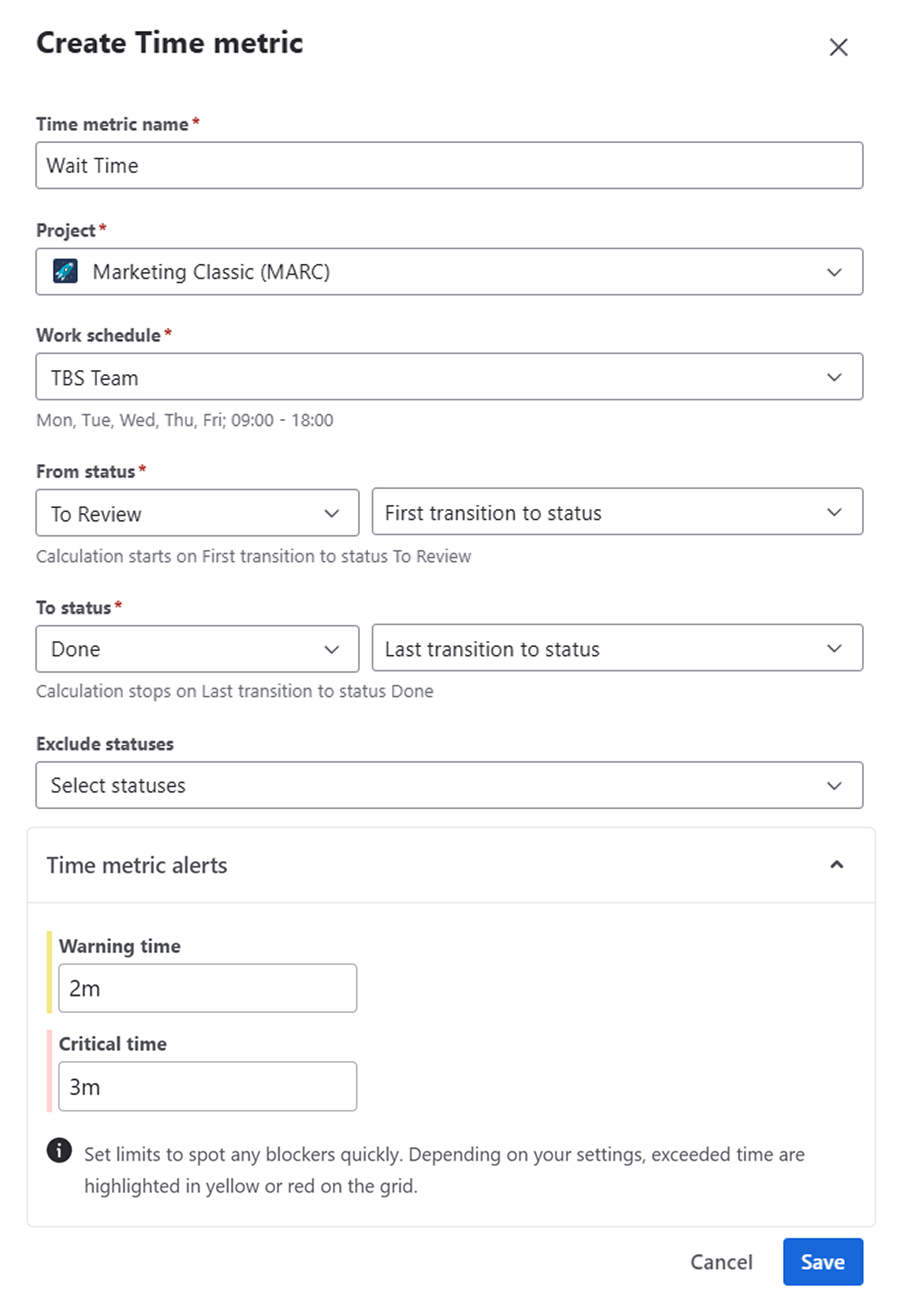
Once you click Save, the specific Wait Time will be calculated and displayed directly on your grid.
⚙️ Customization for Accurate Data
Real life isn't 24/7. To ensure your metrics reflect reality, you can customize the report interface:
- Multi Calendar: Configure non-working hours, weekends, and holidays so that a ticket waiting over the weekend doesn't ruin your metrics.
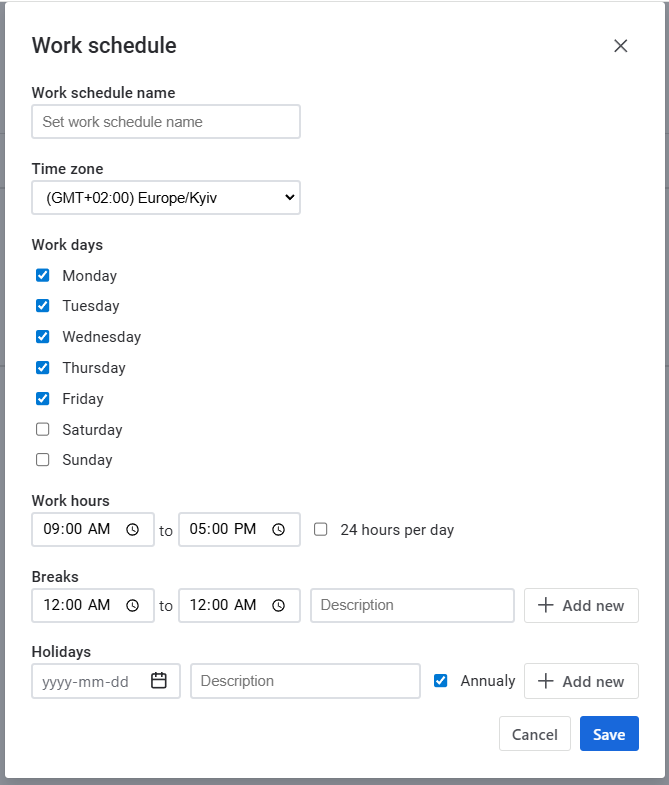
- Project Type & Date Range: Filter specifically for the projects causing you trouble.
- Time Format: Choose how you want to visualize the duration (hours, days, etc.).
📈 The Outcomes
By implementing Time Metrics Tracker, you stop guessing and start knowing.
- Identify Bottlenecks: You might discover that while development takes 2 days, QA waiting time takes 5 days. Hiring more developers won't fix that; hiring a QA engineer or automating tests will.
- Data-Driven Decisions: When you ask management for resources, you have the charts to prove why and where they are needed.
- Export & Share: You can export this data to Excel or Google Sheets to present in your next retrospective or QBR.
Don't get caught up in the Efficiency Paradox. Before you hire your next developer, take a look at your queues.
Try Time Metrics Tracker on the Atlassian Marketplace
