When it comes to analytics, many teams rely on sprint metrics - velocity, planned vs completed, commitment reliability.
But sprint reports don’t always explain what’s actually happening inside the workflow.
We approached it a bit differently.
Instead of analyzing a sprint, we asked AI to analyze flow behavior over time in Jira.
The Prompt
<span>Analyze workflow behavior over the last 30 days.
Identify scope changes, bottlenecks, and flow inefficiencies.
Explain likely causes and suggest next actions.</span>
The system analyzed:
No predefined dashboards - just workflow data.
Step 1: What the Data Showed
The AI reconstructed several core flow indicators:
-
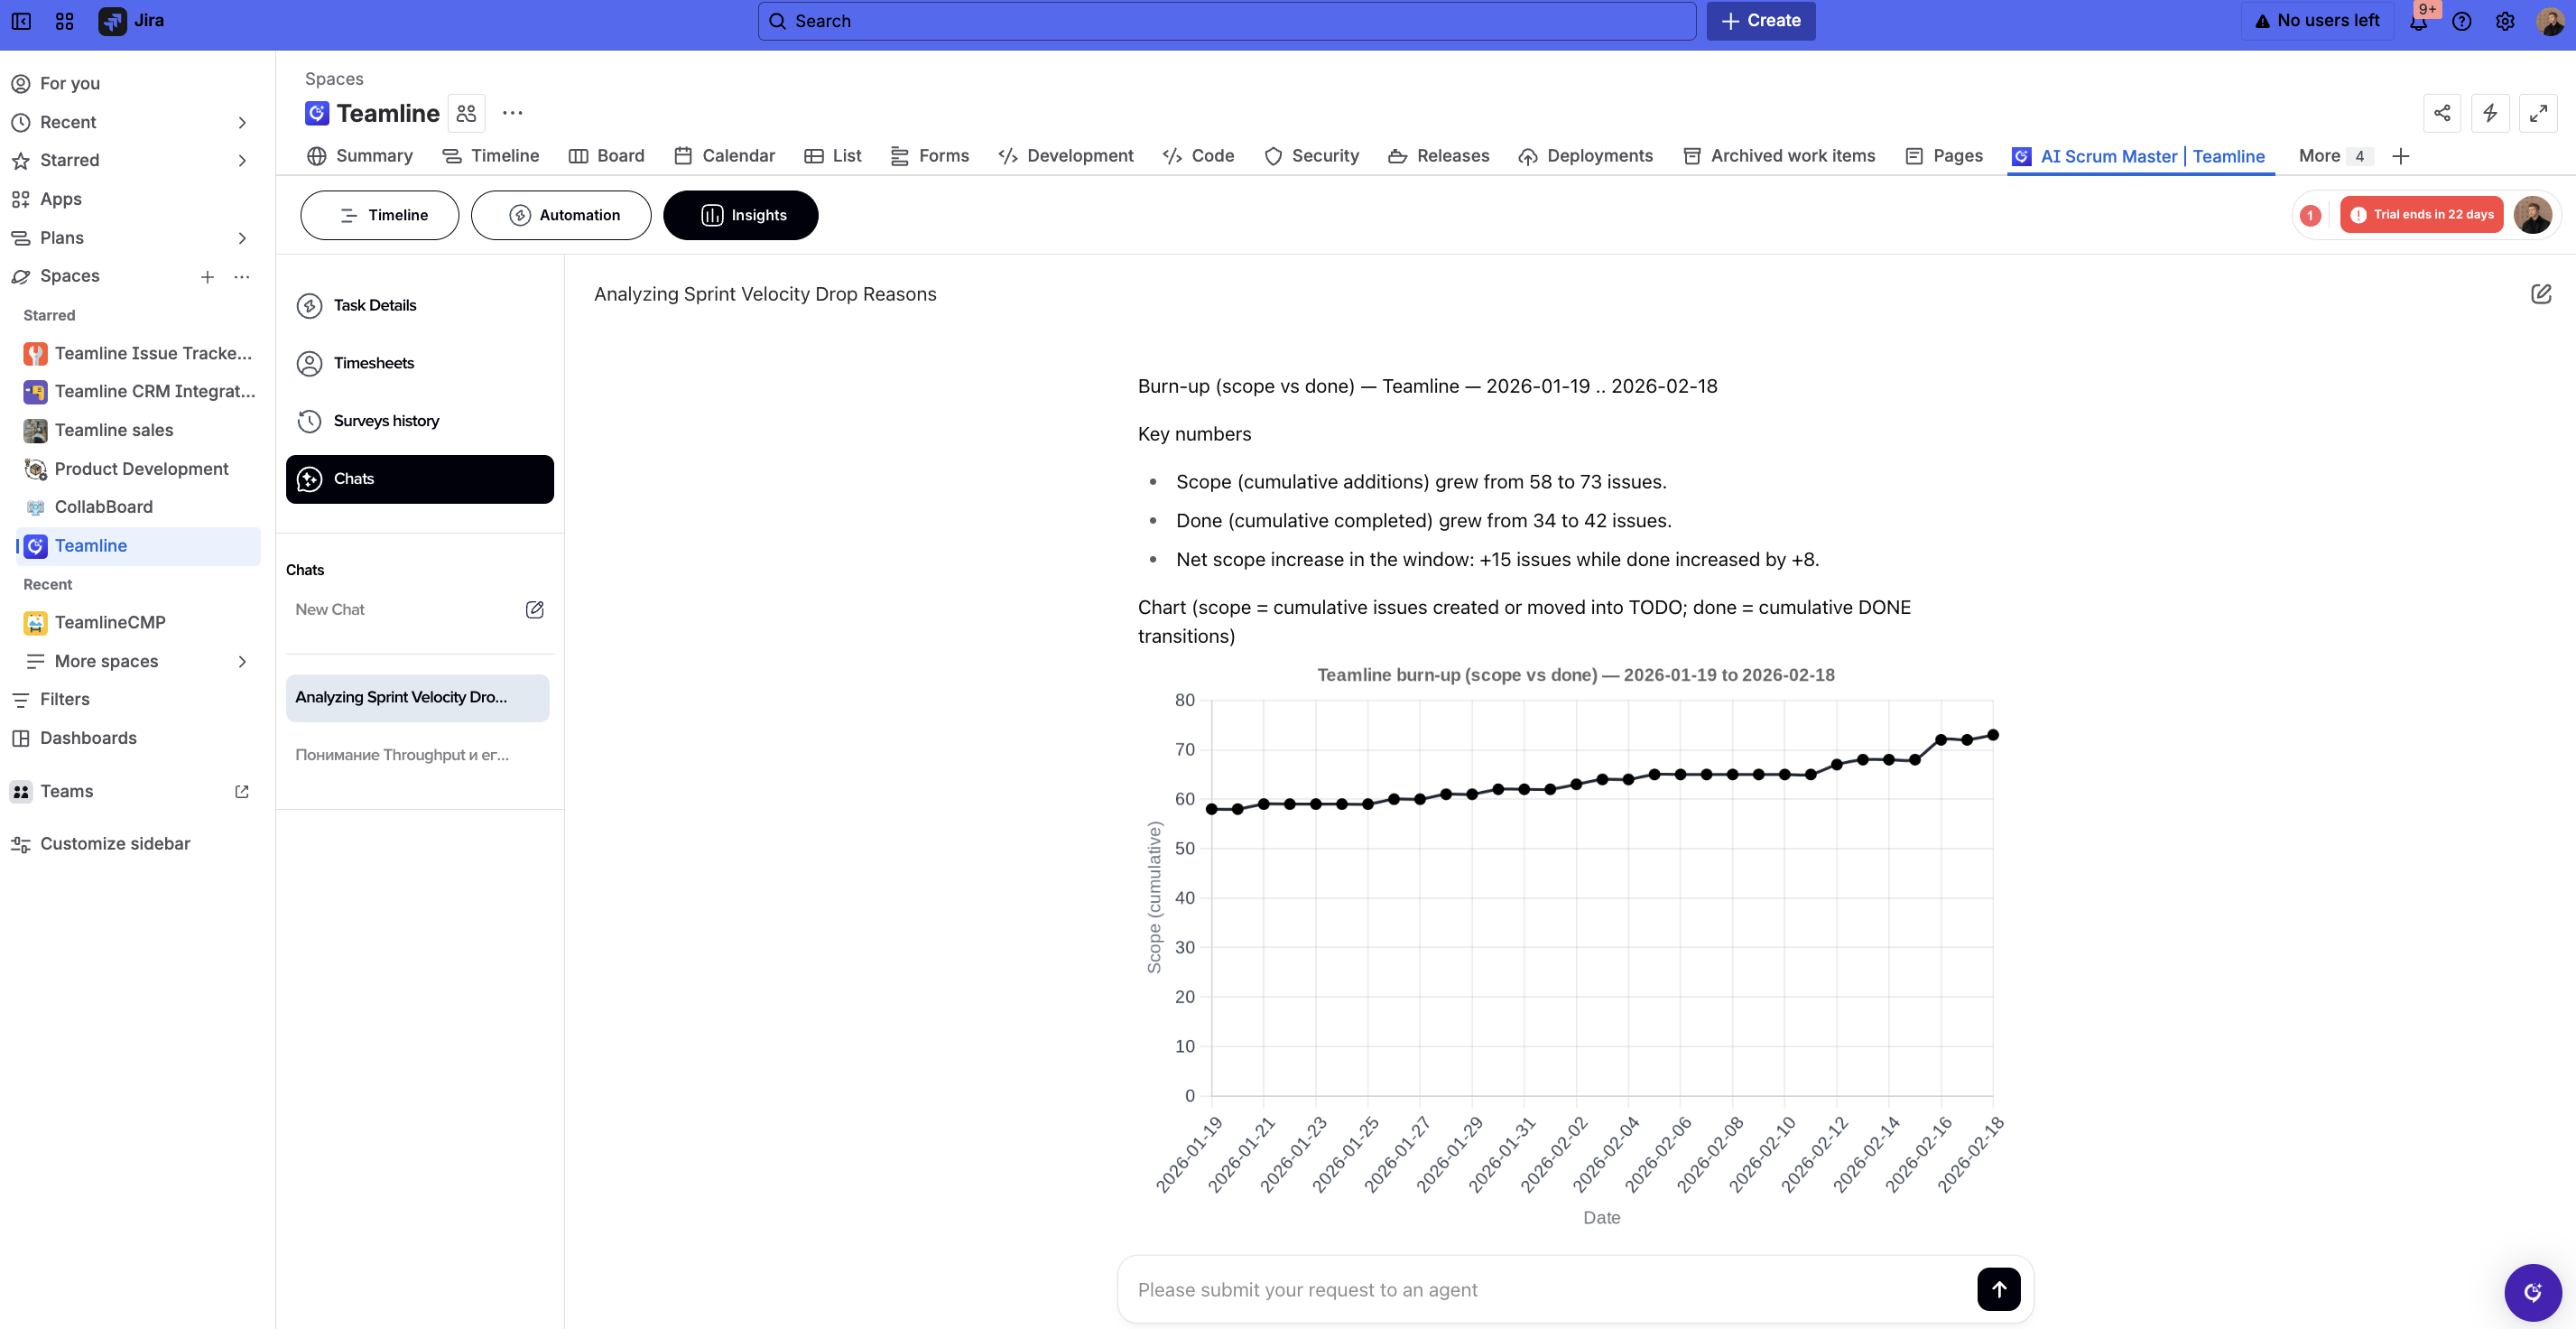
Scope grew from 58 → 73 issues
-
Done increased from 34 → 42
-
Net scope growth: +8
-
Work-in-progress steadily increased
-
Cycle time median was low, but with a visible long tail
On the surface, throughput existed.
But the scope was growing faster than completion.
Step 2: Pattern Correlation
The interesting part was not the numbers - but the connections.
The AI linked:
It highlighted that:
-
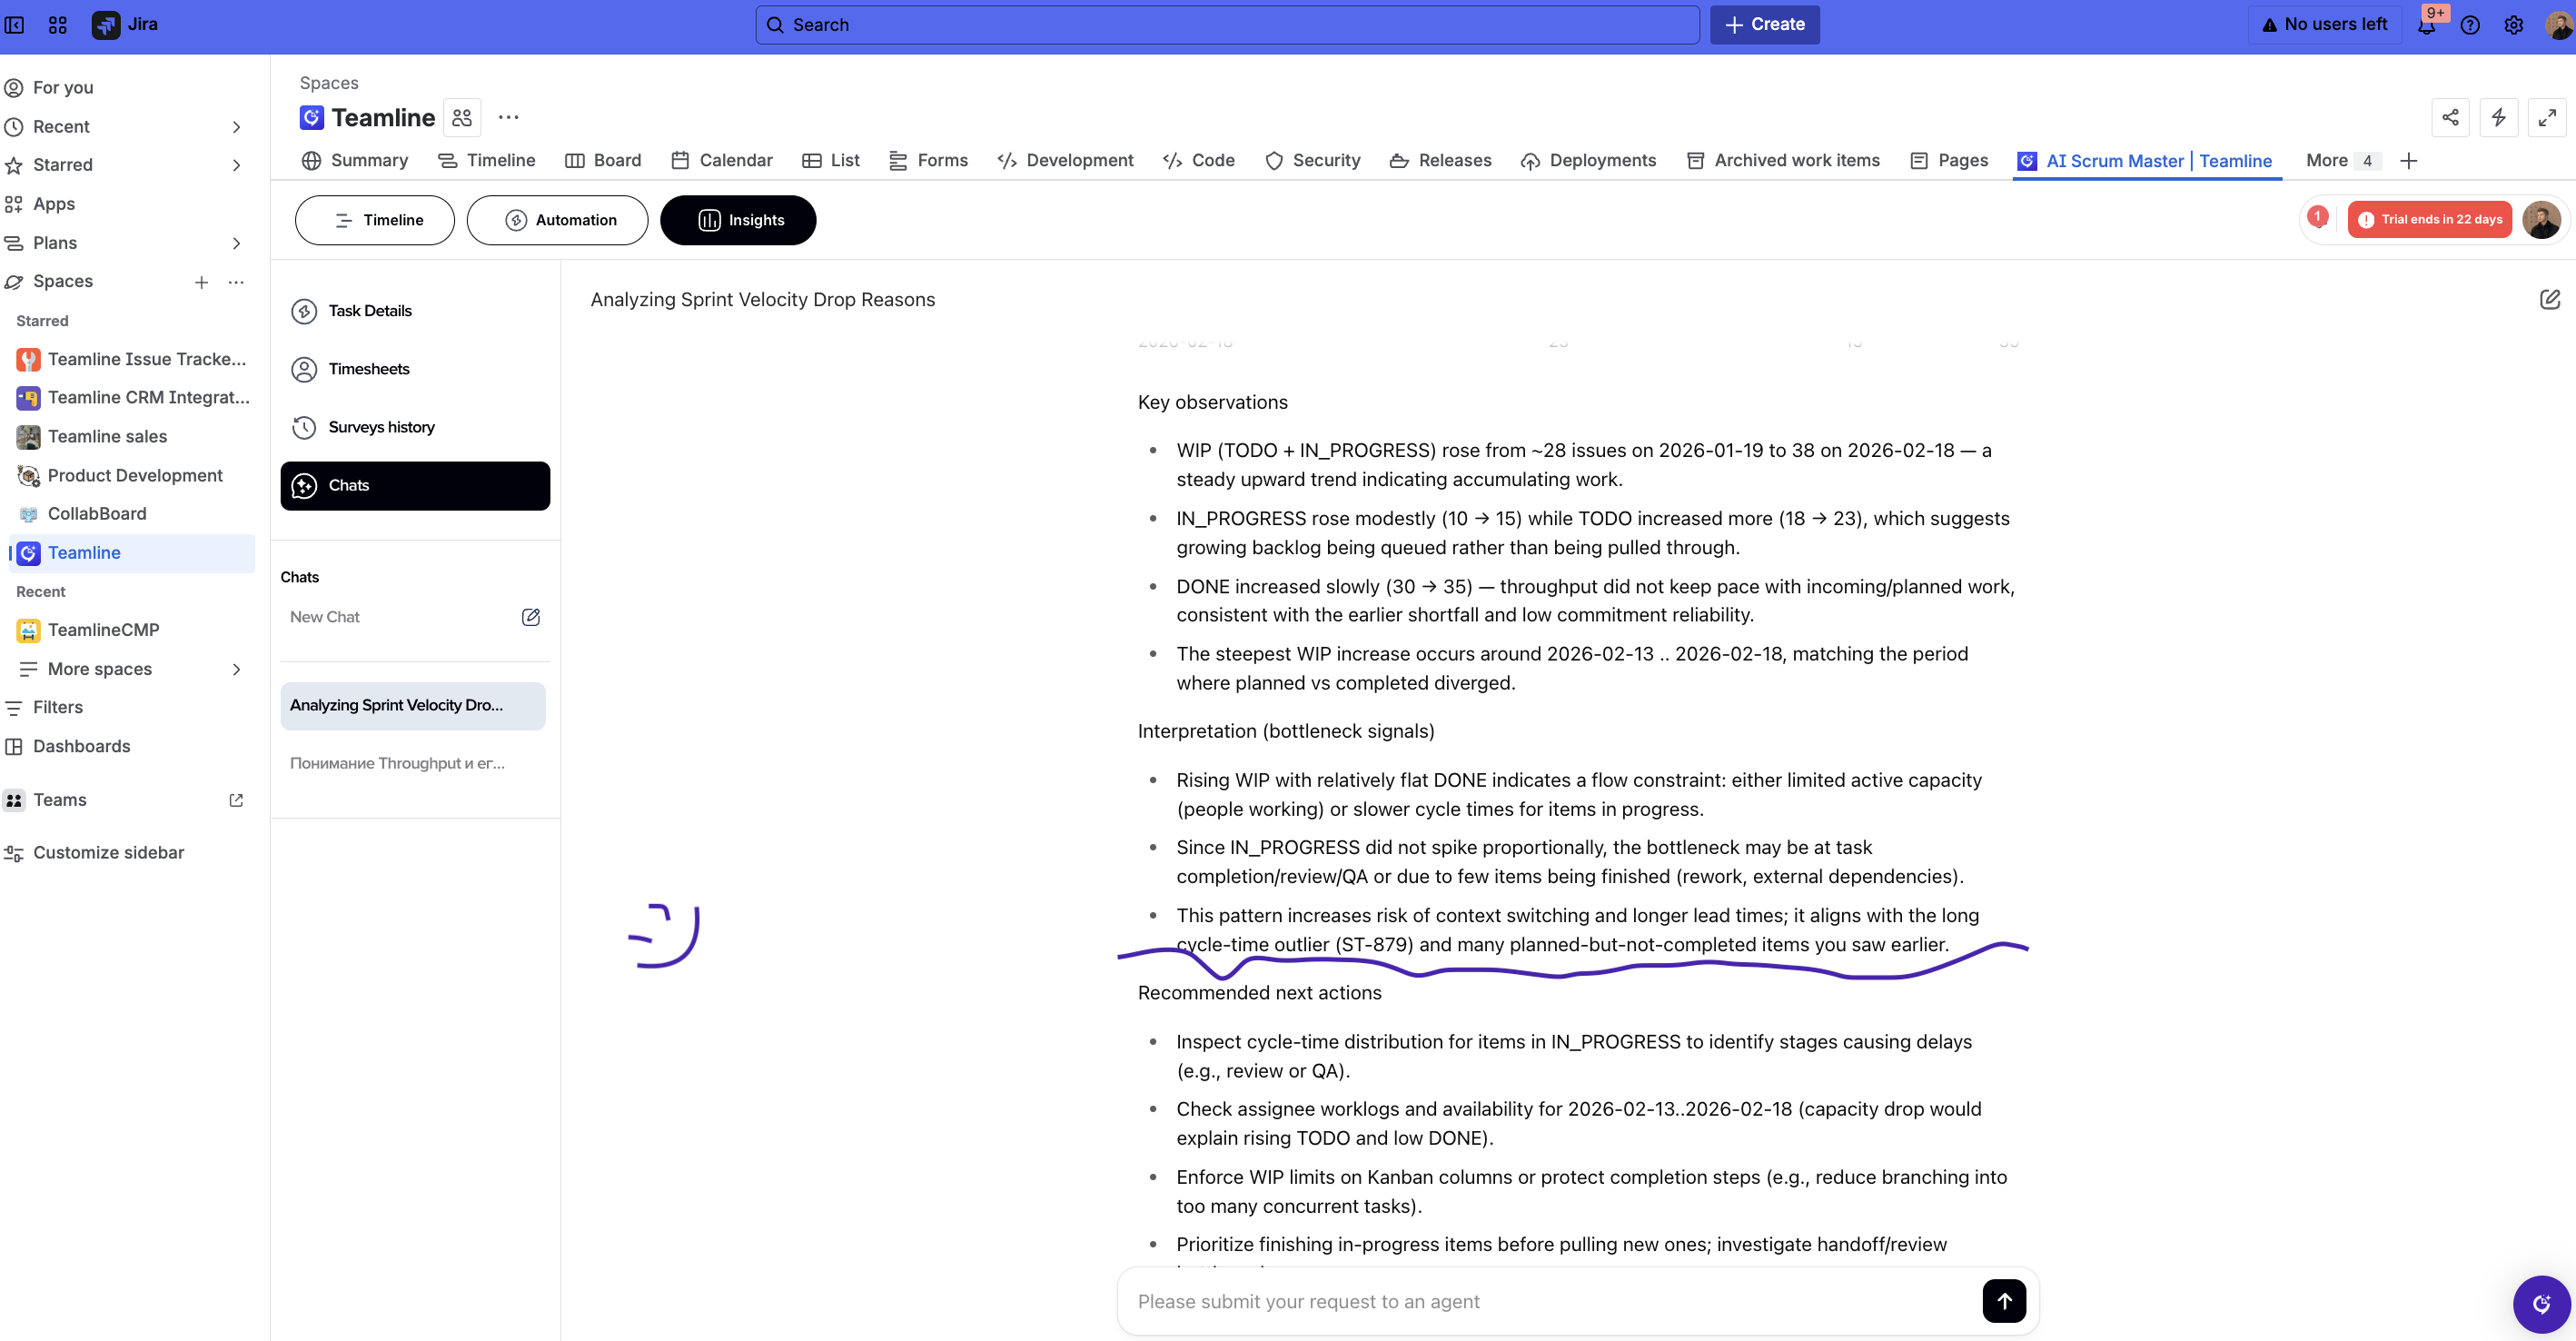
A few large items were consuming disproportionate capacity
-
WIP accumulation suggested unfinished work stacking up
-
Throughput did not fully offset incoming scope
Instead of a single metric, it looked at the system behavior.
Step 3: Suggested Actions
Based on detected patterns, the AI recommended:
-
Inspect the longest-cycle items for blockers or hidden dependencies
-
Check review / QA queues for bottlenecks
-
Freeze scope for a short stabilization window
-
Measure stage-by-stage time in workflow
-
Enforce stricter WIP limits to reduce context switching
These are actions a Delivery Lead might derive manually, but they were surfaced automatically through cross-analysis.
Context
This experiment was conducted inside Teamline, a Jira-based execution and reporting app.
Teamline structures standups and workflow signals around Jira projects. The new AI layer analyzes that structured execution data to surface delivery patterns across time — not just within sprint boundaries.

