Hello community,
I wanted to share a useful tip I recently discovered while experimenting with Rovo—specifically Rovo Labs. This technique allows you to analyze an entire dashboard using Rovo and automatically generate a Confluence page summarizing all key points, metrics, and KPIs.
To do this, I use a browser extension called GoFullPage (though several alternatives exist). It captures the entire dashboard in one shot, regardless of its length, instead of limiting the capture to what is visible on screen.
So, let’s imagine you have a dashboard that monitors your active sprint, a Program Increment, or any other workflow—with dozens of reports (10, 20, or more).
Here’s the process:
1. Capture the dashboard
Use your full‑page screenshot tool to export the dashboard as a .png or .pdf file.
2. Open Rovo Labs
3. Prompt Rovo with instructions such as:
- Analyze the entire dashboard.
- Extract key insights related to [insert sprint name], [insert key indicator], or simply provide a broader dashboard analysis.
- Create a Confluence page summarizing the full dashboard.
- Produce a clean summary with clear section titles.
- Provide analysis for each report.
- Include comparative insights with previous sprints
(if your dashboard doesn’t include historical data, you can provide a screenshot of an older version so Rovo can compare). - Add an executive summary at the top of the page.
- Create tables or structured sections where needed.
- Interpret the metrics and KPIs and suggest potential improvements for future sprints.
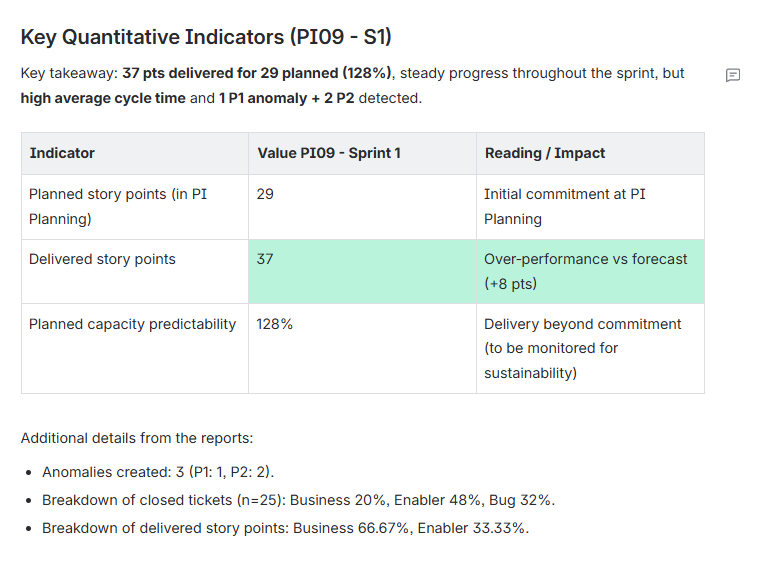
This approach alone can save hours for Product Owners, Product Managers, and other team members.
They get a solid draft to work from at any time, allowing them to focus on reviewing and adjusting Rovo’s analysis using their expertise.
It also ensures that Confluence documentation related to sprint analysis remains clean, consistent, and standardized across teams.
I’d love to hear what you think and whether you’ve tried anything similar.
Kind regards,
Andrei Eleodor Sirbu

