Resolution Time is one of the most essential metrics in Agile and ITSM environments. It reflects how efficiently your team resolves issues a core factor in customer satisfaction, SLA compliance, and internal performance tracking.
In this guide, you’ll learn:
-
What Resolution Time is and why it matters
-
Native ways to track it in Jira
-
Limitations of default reports
-
Pro tips and tools for advanced tracking

✅ What Is Resolution Time?
Resolution Time (also known as Time to Resolution) is the total amount of time it takes to fully resolve an issue — from creation to the moment it reaches a final “done” or “closed” status.
Formula:
Resolution Time = Time from Issue Created → Status Category “Done”
It includes all working and waiting time unless filtered otherwise.
💡 Why Track Resolution Time?

Understanding and optimizing Resolution Time helps you:
-
Meet SLAs: Ensure you’re responding and resolving within agreed timelines.
-
Spot blockers: Identify bottlenecks in processes (e.g., QA delays).
-
Improve customer satisfaction: Faster resolution = happier users.
-
Drive internal improvements: Analyze which teams or projects struggle with long waits.
-
Support audits: Provide standardized reports on team performance.
🛠️ How to Track Resolution Time in Jira (Native Features)
1. Jira Issue Fields
By default, Jira issues include:
You can create calculated fields or custom dashboards to show:
However, this view is very limited if you want detailed insights like:
2. Jira Reports
In Jira Service Management, you get built-in reports like:
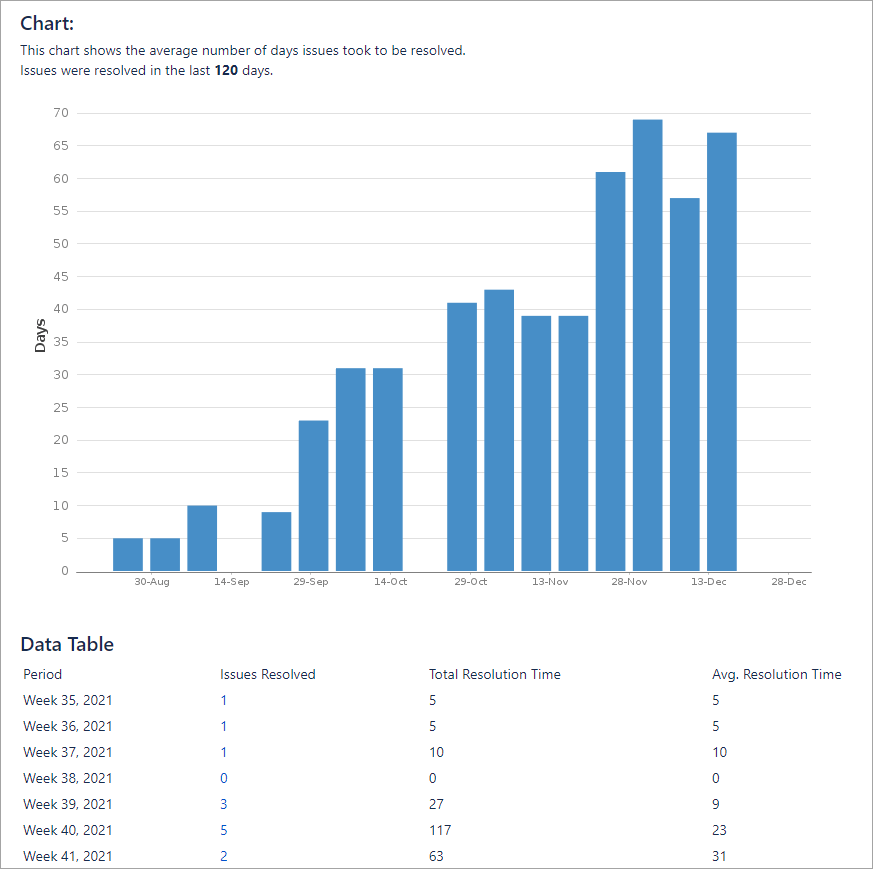
But these are available only in specific templates, and:
-
Can’t be customized deeply
-
Don’t support Software projects
-
Don’t offer historical status change insights
🚀 Advanced Tracking with Marketplace Apps
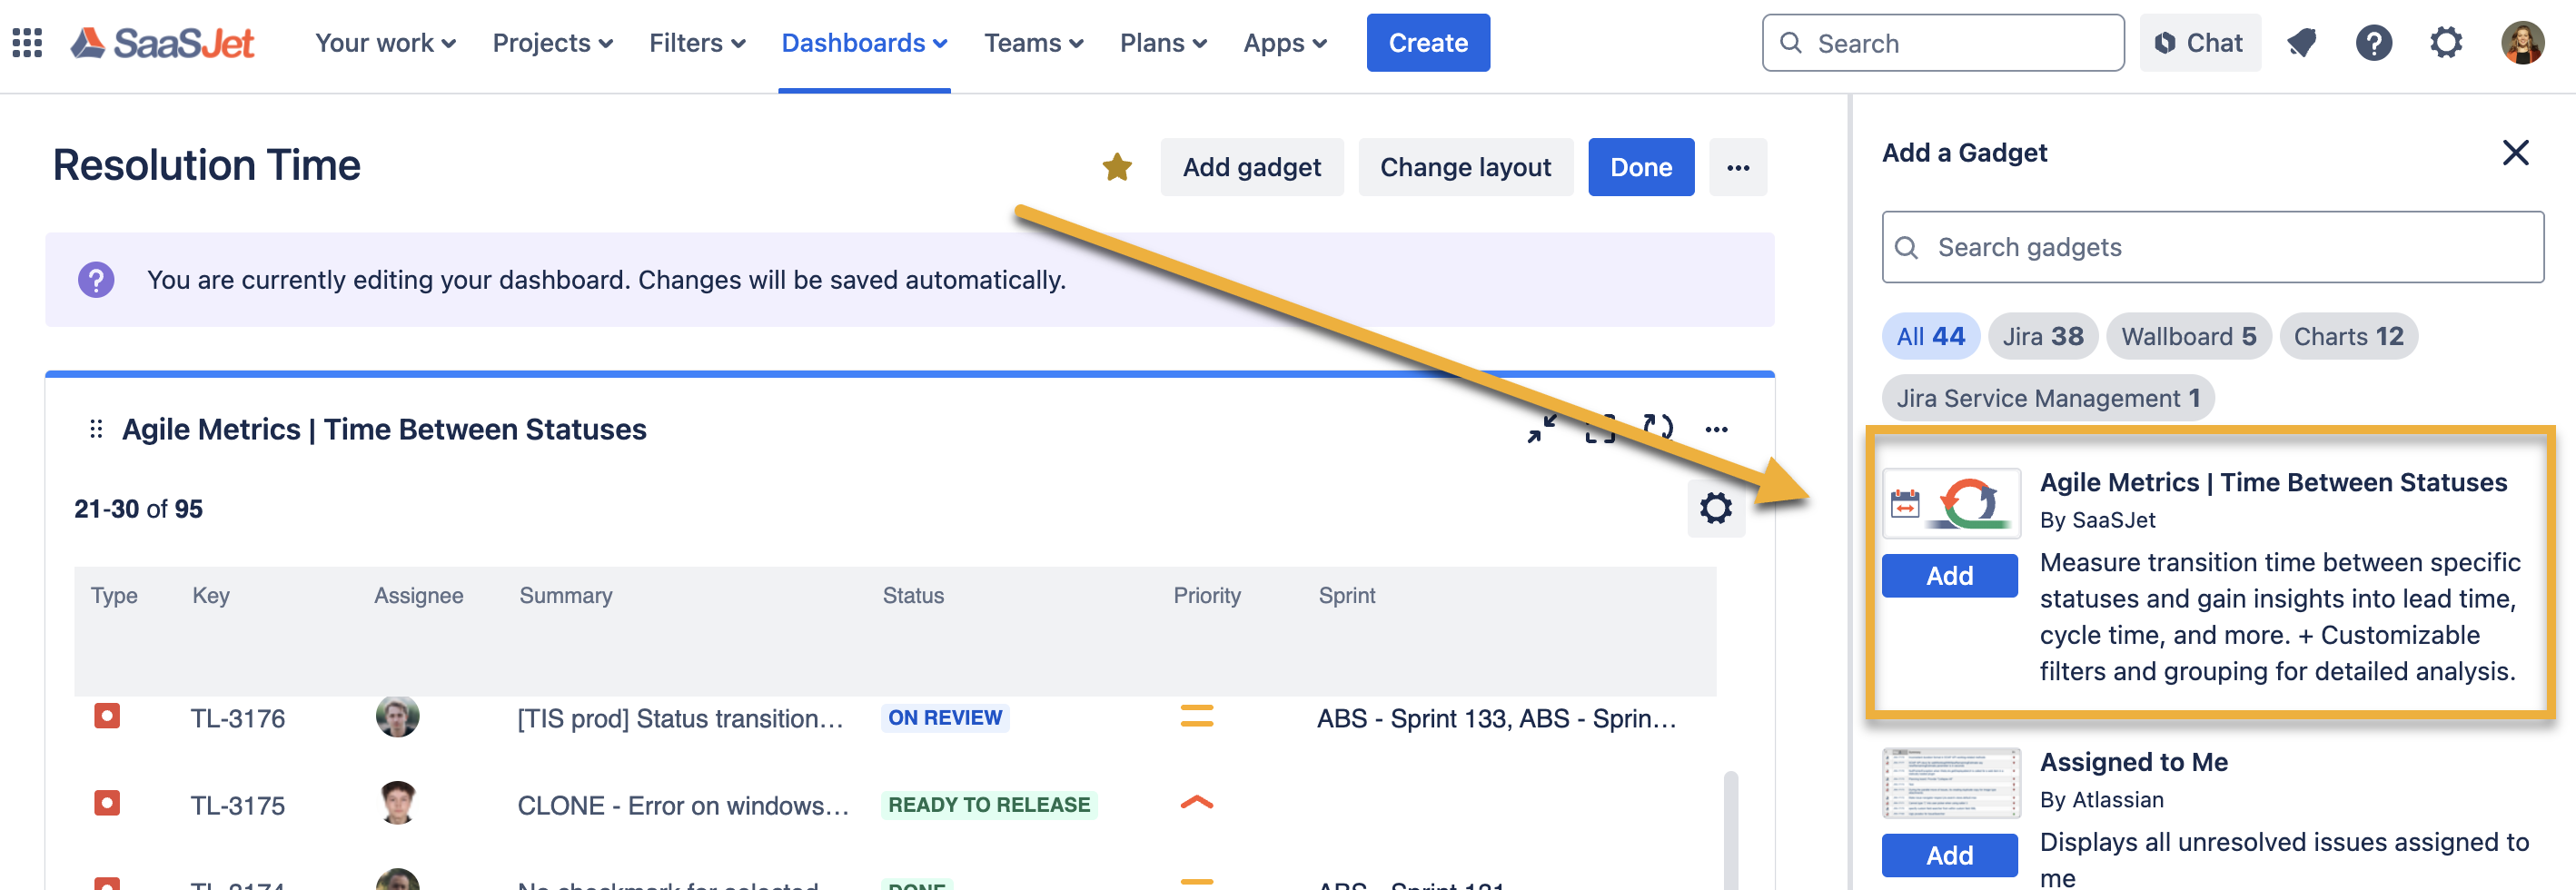
To get real visibility, use marketplace apps that calculate time between specific status transitions. One of the most effective tools is:
Key Features:
-
Track Resolution Time (from any status to any “done” status)
-
Get cycle time, lead time, waiting time, and custom transitions
-
Build audit-ready reports (CSV, charts)
-
Works across Jira Software, Business, and ITSM projects
Example Use Case:
-
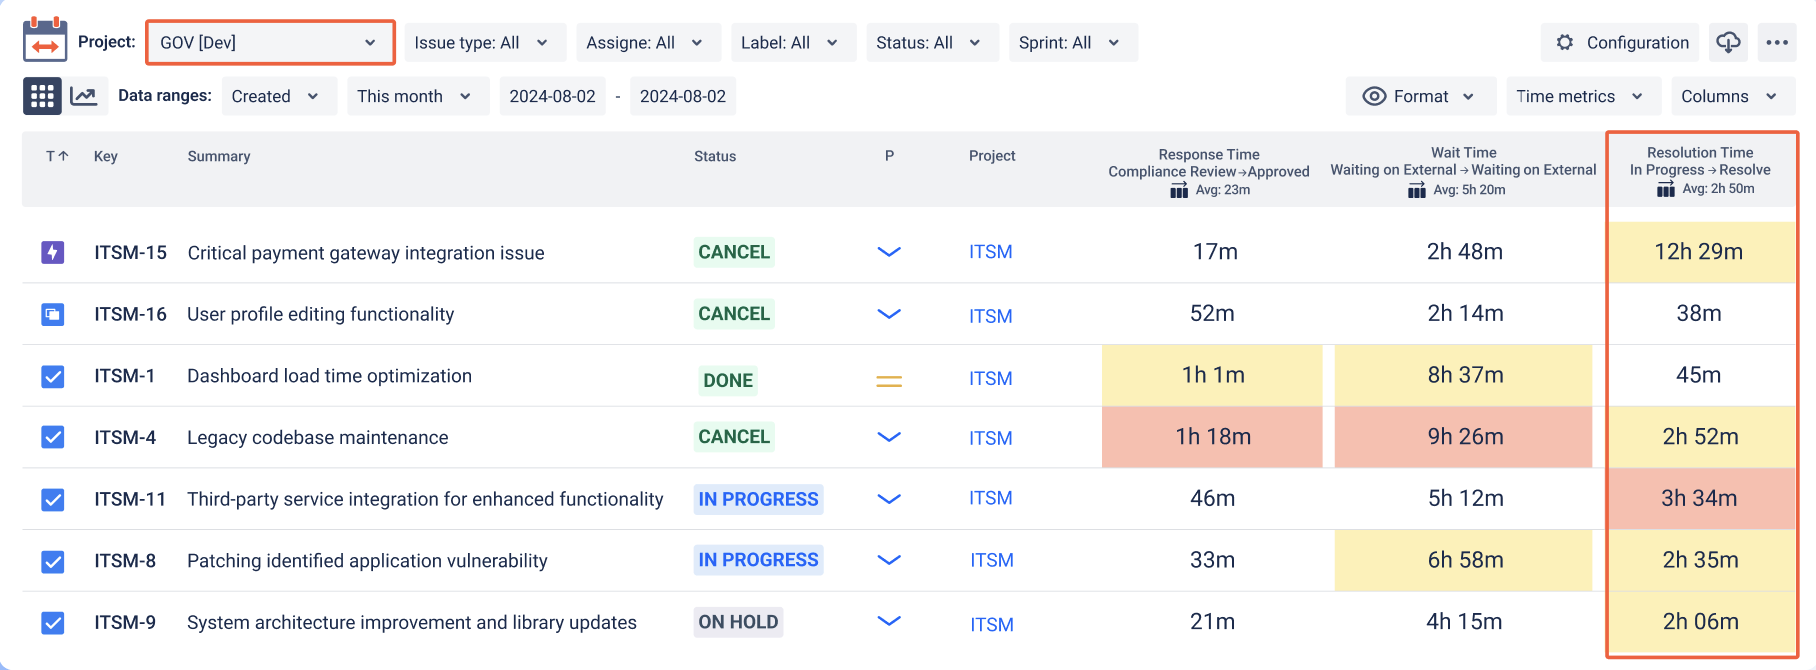
Track average Resolution Time across your support team
-
Compare Resolution Time per assignee or team
-
Measure how long issues stay in “In Progress” before closing
🧪 Best Practices for Tracking Resolution Time
-
Define "Resolution" precisely
→ Use consistent statuses across projects (e.g., "Done", "Closed", "Resolved")
-
Set up SLA thresholds
→ Create alerts or dashboards for issues over threshold (e.g., > 48h)
-
Segment data
→ By issue type, priority, assignee, or label for deeper insights
-
Automate reporting
→ Use apps to export weekly/monthly reports
-
Combine with other metrics
→ Correlate with Cycle Time, Time in QA, or Time in Review to spot root causes
📊 Sample Dashboard Widgets (with Time Metrics Tracker)
| Metric |
Visualization |
|---|
| Average Resolution Time |
Line chart (per week) |
| Outliers (> 5 days) |
Filtered table |
| Median per team/project |
Bar chart |
| Breakdown by priority |
Pie chart |
⚠️ Common Pitfalls to Avoid
-
❌ Tracking only Resolved Date without looking at time in statuses
-
❌ No historical tracking – Jira doesn’t store old status durations natively
-
❌ No segmentation – viewing overall metrics without context
-
❌ Relying on manual exports – which are slow and error-prone
🧭 Conclusion
Tracking Resolution Time in Jira is key to driving better performance, faster delivery, and happy stakeholders. While Jira gives a basic view, you’ll need additional tools like Time Metrics Tracker to unlock deep insights and automation.
✨ Want full visibility of your workflows and resolution metrics?
Try Time Metrics Tracker to build powerful reports with zero setup.
