Tracking costs in Jira usually starts at the project level. But as soon as you manage multiple projects, clients, or initiatives, one question inevitably comes up:
“What is our total spend across everything?”
Exporting reports, merging spreadsheets, and reconciling numbers manually is time-consuming and error-prone. This is exactly the problem Project Portfolios in Time & Cost Tracker are designed to solve.
In this article, we’ll look at how portfolio cost reporting works in Jira and how you can use it to get a clear, high-level financial view across all your projects.
Why project-level cost reports aren’t enough
Cost reports per project are great for execution and day-to-day tracking.
But they fall short when you need to:
- See total spend across multiple Jira projects
- Track budgets and remaining funds at a program or client level
- Compare financial performance across teams or initiatives
- Report to stakeholders who don’t care about individual issue details
This is where Project Portfolios come in.
What are Project Portfolios?
Think of Portfolios as organizational folders for cost reports.
Instead of viewing each project in isolation, portfolios allow you to group multiple Cost Reports and see their combined financial data in one place.
You can organize portfolios by:
- Client
- Department
- Product or initiative
- Quarter or fiscal period
- Team or delivery stream
The result: one consolidated financial view, without manual data consolidation.
How to set up portfolio cost reporting
Getting started is straightforward:
1. Open Portfolios
From the Time & Cost Tracker main menu, go to Portfolios.
 2. Create a new portfolio
Click Create Portfolio and give it a clear, descriptive name
(for example: “Client X – All Projects” or “Q1 Marketing Initiatives”).
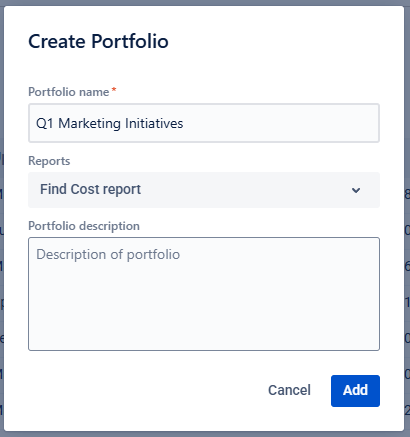
3. Add existing Cost Reports
Select the Cost Reports you want to include. You can search by name to quickly find them.
That’s it — your portfolio is ready.

What financial data can you see at the portfolio level?
Once created, the Portfolios page shows a summary table with aggregated metrics across all included reports.
Key metrics include:
- Total Cost
Combined labor costs and direct expenses
- Total Billing
Aggregated billable or revenue amounts
- Total Budget
Sum of all planned budgets from the included reports
- Remaining Budget
Automatically calculated as Total Budget – Actual Costs
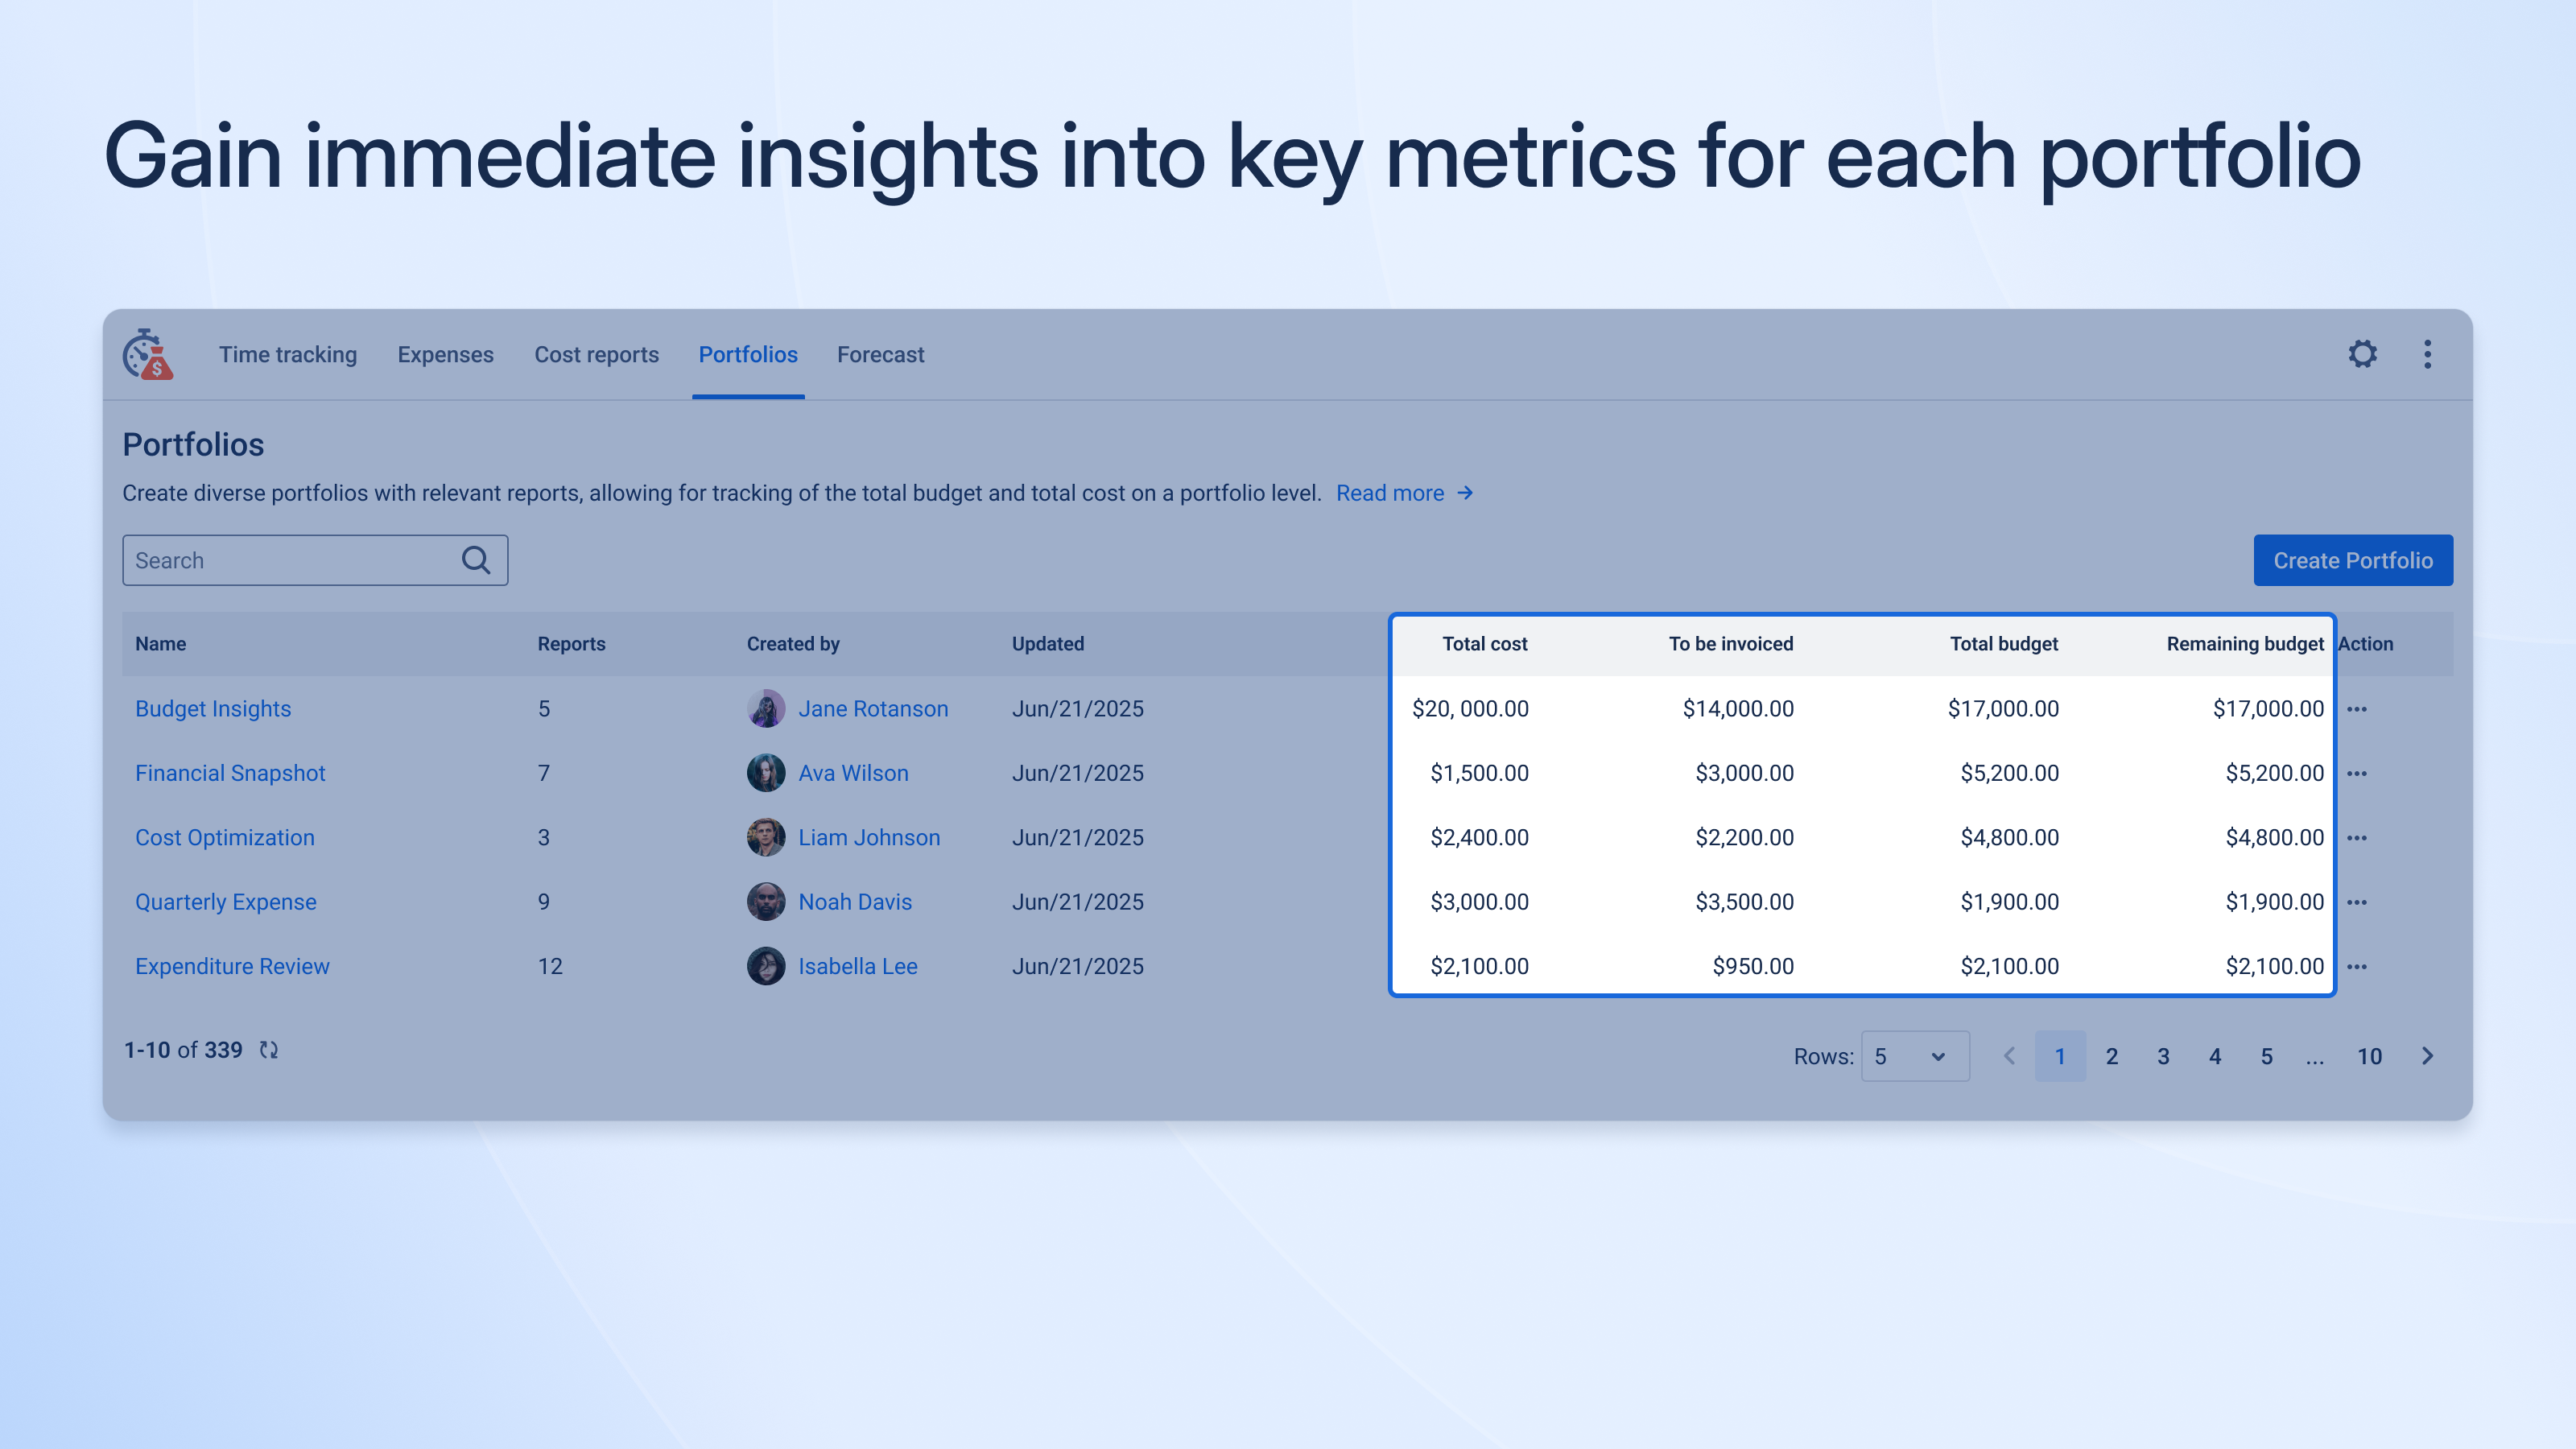
This gives you an immediate answer to the most important question:
“Are we on track financially across all projects?”
Common use cases for portfolio reporting
📊 Financial analysis
Consolidate data across departments or teams to identify trends, overspending, or underutilized budgets—without exporting data to external tools.
📋 Project & program management
Monitor cost and progress across multiple projects at once, spot risks early, and align teams before issues escalate.
🤝 Client management
Create client-specific portfolios to provide transparent, high-level financial reporting across all delivered services.
📣 Marketing & sales
Track campaign costs, compare initiatives, and evaluate overall ROI to make better resourcing decisions.
Access control and portfolio management
Because portfolios often contain sensitive financial data, access is controlled via permissions.
To create or edit portfolios, users must have:
“Manage Rates, Expenses, Reports and Portfolios” permission.
A few important notes:
- Portfolios can be edited or deleted at any time
- Deleting a portfolio does not delete the underlying Cost Reports
- Reports remain intact and reusable in other portfolios
This makes portfolios safe to adjust as your organizational structure evolves.
A simple way to think about it
Using Project Portfolios is like managing a fleet of ships:
- A Cost Report shows you fuel usage and cargo value for one ship (one project)
- A Portfolio shows the Admiral the total fuel consumption, remaining supplies, and overall progress of the entire fleet
Same data — just the right level of visibility.
Final thoughts
If you’re already tracking time and costs in Jira, portfolios are the missing layer that turns detailed data into strategic insight.
They eliminate manual consolidation, improve financial transparency, and help teams move from reactive cost tracking to proactive decision-making.
If you’re managing more than one project, chances are — you’re ready for portfolio reporting.
Start tracking! 🚀
