SaaSJet Advent Calendar – The Postcards We Never Sent
Welcome to another day in the SaaSJet Advent Calendar – a collection of postcards inspired by real moments in Jira, real emotions from teams, and the small professional heartbreaks we've all survived.
Some postcards come from victories. Some from burnout. And today’s postcard... comes from a place every manager knows too well: the spreadsheet spiral.
When Reporting Becomes a Horror Genre 😱📊
If you’ve ever tried to build a “simple weekly SLA report,” you already know this story.
It begins innocently:
- Download a CSV.
- Add a pivot table.
- Color the cells.
And everything looks great… for about 7 seconds.
Then someone asks: “Why does this chart say we met 90% of SLAs, but the other one says 63%?”
You check the filters. You check the date ranges. You open version 3 of the spreadsheet, then version 5_final, then 7_final_FIXED. Eventually, you discover version 10_final_really_final_v2 — and somehow it still doesn’t match the others.
That is the moment when reporting stops being analytics...
...and becomes emotional damage.
💥 The Pain Behind Mismatched Reports
Here are the quiet (and not-so-quiet) pains no one admits out loud:
- Every manager has lost hours reconciling reports that should have matched but didn’t. Different filters. Different exports. Different assumptions. Different versions. Jira data scattered across too many hands.
- Manual SLA reporting often becomes a chain of guesswork, not clarity. When numbers disagree, trust in the whole process collapses.
- Teams make decisions using incomplete, outdated, or inconsistent data. And that’s how SLA breaches — big, small, and embarrassing — slip through unnoticed.
- The reporting workload grows with every sprint, every team, every new layer of approvals. Managers end up drowning not in problems, but in spreadsheets ABOUT problems.
If you’ve ever whispered “I hate reporting” to your laptop at 1 AM… consider this postcard written just for you.
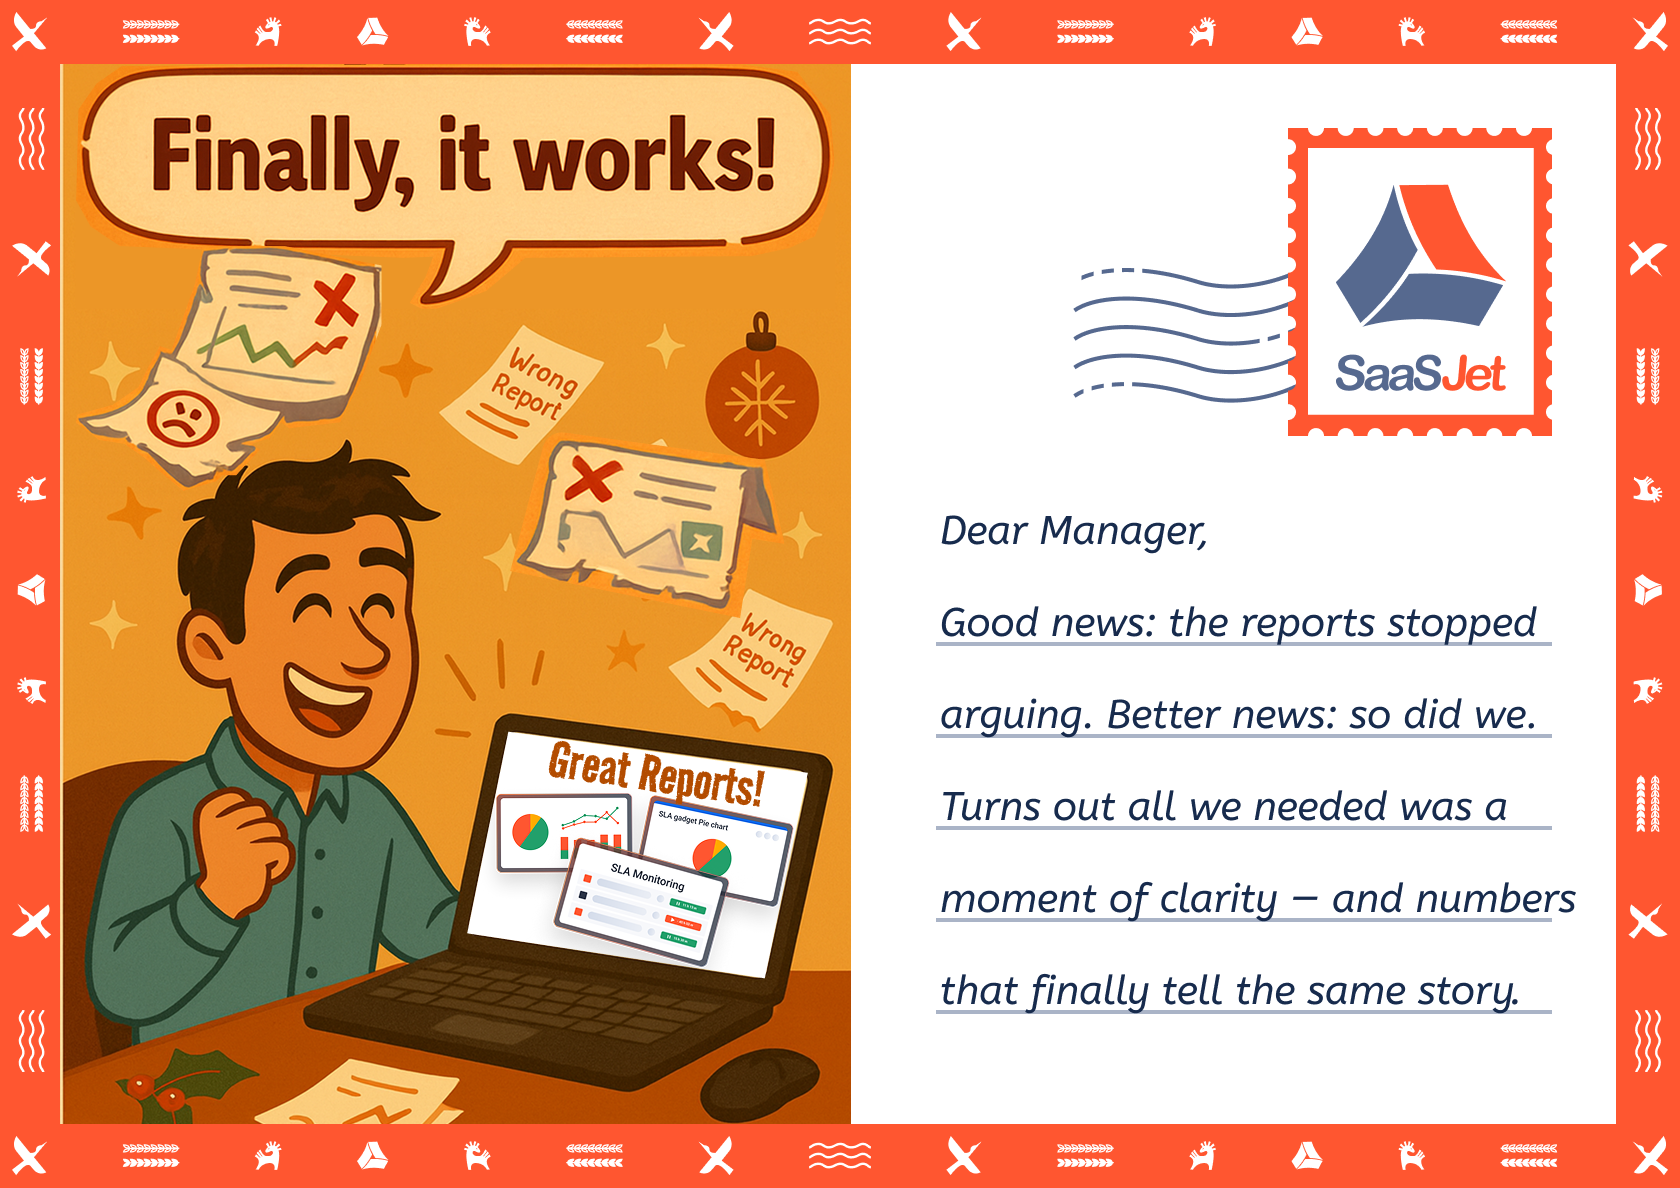
🎁 The Turning Point: When Automation Finally Arrives
The story changes when reporting stops relying on:
- “Who exported this file?”
- “Which filter did you use?”
- “Wait, why is this chart different?”
- “Can someone send me the latest version?”
...and starts relying on real-time SLA data right inside Jira.
This is exactly the problem that inspired us to build the app SLA Time and Report for Jira.
Instead of exporting data into ten different spreadsheets, teams get:
✔ Accurate SLA metrics automatically calculated. No formulas, no manual reconciliation, no “why doesn’t this match the other one?” ✔ Unified reporting for managers, support leads, and product teams. Everyone sees the same numbers — at the same time. ✔ SLA compliance dashboards, Met vs Exceeded charts, and trend analytics. Decisions come from insights, not intuition. ✔ Filters and criteria that stay consistent. The source of truth lives in Jira, not in duplicated files on personal desktops. ✔ Reports that don't break when someone sneezes at the spreadsheet. A massive upgrade from “version 10_final.xlsx.”
Suddenly, the nightmare of mismatched reports becomes... a quiet, peaceful evening.
(Yes, we’ve seen managers smile watching a chart load correctly — it’s beautiful.)
🎄 Final Thoughts – And Why This Became an Advent Postcard
The truth is: consistent reporting is the backbone of any reliable service team. But the manual reconciliation process? It's a shared organizational trauma wrapped in layers of Excel files and tied with a ribbon of "Wait, which V10 is the final one?" The spreadsheet spiral may have been painful, but it gave the community:
- New ways to argue about filters
- A deeper understanding of why "trust the numbers" is hard
- Dozens of threads asking "Is my data right or is Jira lying?"
- A collective relief when the numbers finally, somehow, matched
And that’s why this Advent Calendar exists:
To celebrate the chaos, the small victories, and the simple relief that comes when you stop chasing data and start using it. The reporting nightmare may have been tough, but the solution is clear: automate the headache away.

❄️ Happy holidays from the SaaSJet team 🎄
May all your charts load correctly on the very first try!
