Hey Atlassian Community! 👋
At Broken Build, we're constantly evolving our suite of tools to tackle the core challenges facing Agile teams. We recently launched Agile Cumulative Flow Charts to help you track flow stability with Arrival Rate, Departure Rate (Throughput), and WIP to stay aligned with health metrics. Now, we're excited to announce our next innovation: Agile Created Resolved Charts – coming soon to the Agile Reports suite!
💌 Join the waiting list:
Why Created vs. Resolved Charts matter
Ever wondered if your team is keeping up with demand? Are new items flooding in faster than you can deliver? Created vs. Resolved Charts (sometimes called Throughput Charts) answer the fundamental question every Agile team needs to ask: Are we in balance?
Whether you're running Scrum sprints, managing Kanban workflows, handling service desk tickets, or coordinating at SAFe portfolio levels, this app gives you the visibility to keep queues under control and catch problems before they escalate.
What's coming: Key features of Agile Created Resolved Charts by Broken Build
1️⃣ Flexible chart configuration – your data, your way
Configure exactly how you want to measure flow through your system:
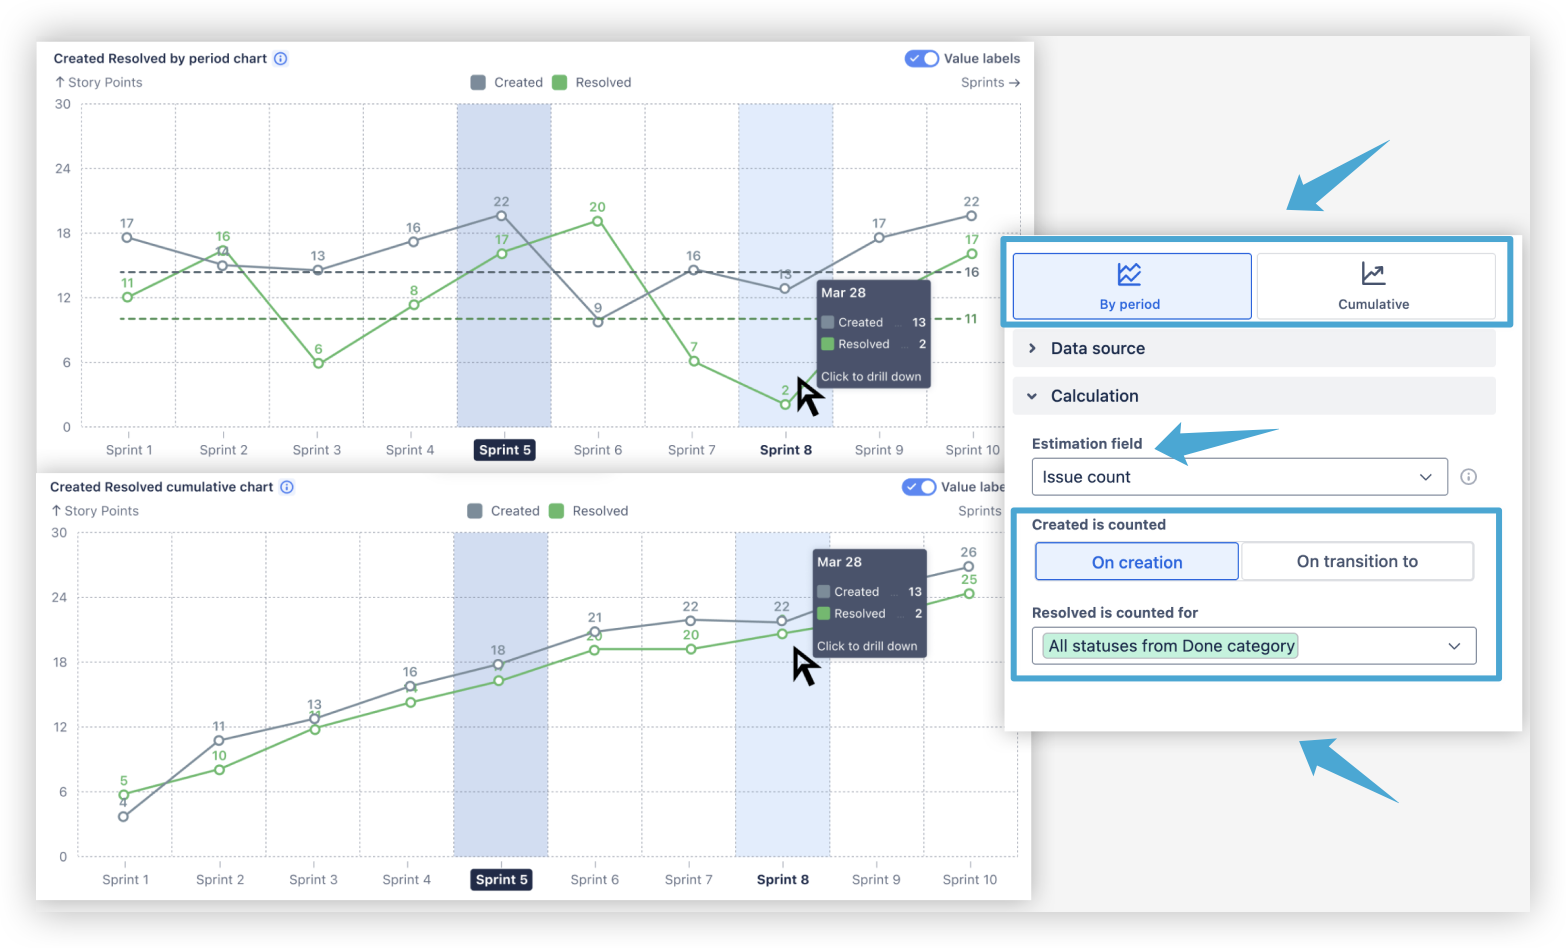
🔷 Chart modes:
-
By Period (run) view – See arrivals vs. departures per sprint, week, or day to spot capacity imbalances
-
Cumulative view – Track inventory growth over time and predict when backlog pressure will hit critical levels
🔷 Calculation options:
-
Define what counts as "Created" – on issue creation or when work enters a commitment gate (like "Ready for Dev")
-
Choose which statuses mark work as "Resolved" – all Done statuses or specific completion criteria
🔷 Estimation fields:
-
Track by Story Points, Original Estimate, Time Spent, or any custom numeric field
-
Or simply count items when estimation isn't used
2️⃣ Intelligent chart tuning – optimize your view
Fine-tune your throughput analysis to match your team's rhythm:
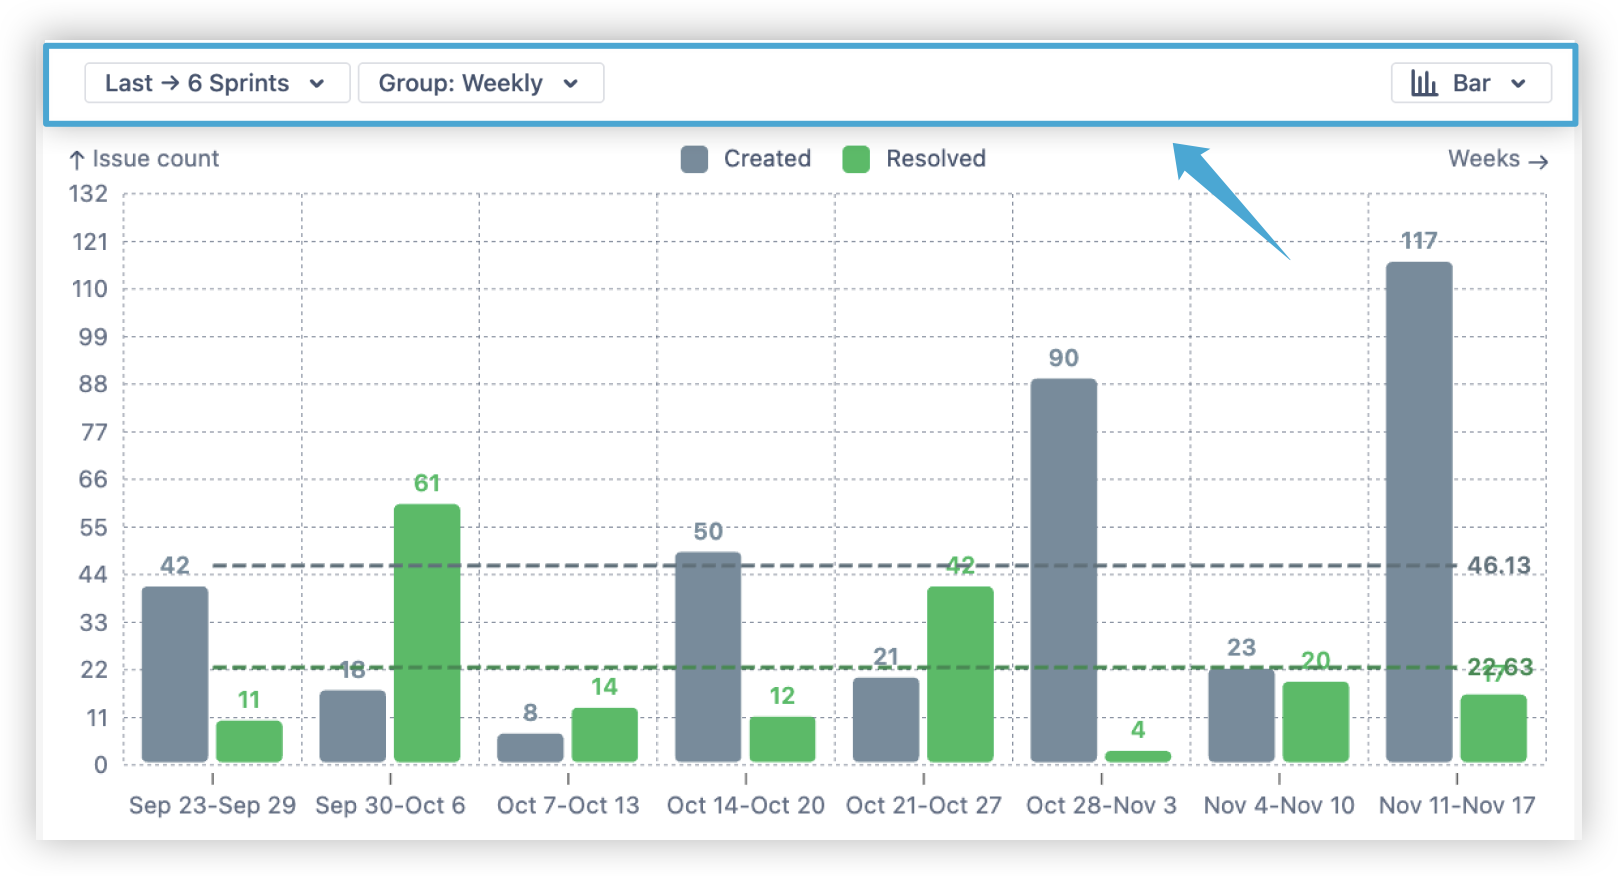
🔷 Timeframe selection:
-
Pick preset ranges (last 10 sprints, last 30 days) or set custom date windows
-
Exclude active periods to avoid skewing metrics with incomplete data
🔷 Data grouping:
-
Daily grouping for Kanban teams and service desks
-
Weekly grouping for stable trend analysis
-
Monthly grouping for program or portfolio views
-
By Sprint grouping for Scrum teams
🔷 Chart types:
3️⃣ Multi-source data integration – one view for everything
Pull throughput data from wherever your work lives:
✅ Scrum or Kanban boards – track one or combine multiple boards
✅ Projects and Releases – filter by specific versions and deliverables
✅ Custom JQL / Saved Filters – create cross-project views, QA stage analysis, or service desk monitoring
...and more features coming your way!
💡 What this means for your team
The Created vs. Resolved Charts transform how you handle demand and delivery:
💠 Balance demand & capacity – spot when arrivals consistently outpace departures before your backlog spirals out of control
💠 Stabilize throughput – identify variability patterns and eliminate batching behaviors that create unpredictable delivery
💠 Control scope creep – watch the gap between what arrives and what ships to manage backlog pressure proactively
💠 Predict delivery risks – catch early warning signs of cycle-time problems and coordinate interventions before commitments slip
The result? Teams that maintain a sustainable delivery pace, stakeholders who get realistic forecasts, and leaders who can make capacity decisions based on real throughput data instead of guesswork.
🚀 Stay tuned for the launch!
Want to be the first to know when Agile Created Resolved Charts goes live?
💌 Join the waiting list:
🧭 Explore more:
📦 Available now: The Broken Build Agile suite
While you wait for Agile Created Resolved Charts, explore our existing apps designed to give your team complete visibility:
🔷 Individual apps:
🔷 Complete solution:
-
Agile Reports & Gadgets (Bundle) - Access the combined capabilities of our four individual apps in a single comprehensive package, including Velocity Charts, Cycle Time Charts, and Burnup Burndown Charts.
Keep your demand & capacity balanced, your entry & output stabilised, and your delivery predictable. Discover new Agile insights with Broken Build – because better visibility means better decisions.
Cheers,
The Broken Build Team 🚀
