Jira is an incredibly flexible platform for managing workflows, but when it comes to analyzing how time is actually spent across those workflows, its native capabilities often fall short. Sure, you can track when someone logs hours—but that doesn’t tell you where work stalls, what phases are slowing you down, or how long an issue waits before being picked up.
In this article, we’ll break down the limitations of Jira's native time tracking, explain the critical difference between logged time and time between statuses, and show how Time Metrics Tracker | Time Between Statuses enables process-level insights for teams aiming to optimize delivery, compliance, and team efficiency.

Native Time Tracking in Jira: What It Does (and Doesn't Do)
Jira’s built-in time tracking allows users to:
🟢 Useful for:
🔴 Limitations:
-
Manual entry only (human error, inconsistency)
-
Doesn’t reflect passive wait time or flow bottlenecks
-
No visibility into time spent in each status (e.g., how long an issue sat in “In Review”)
❝ You know someone spent 5 hours coding—but not that the ticket sat 3 days waiting for QA. ❞
This lack of visibility makes Jira’s native tracking inadequate for teams focused on process optimization.
The Problem with Native Time Tracking in Jira
Jira’s default time tracking tools—like “Time Spent” or “Original Estimate”—are great for basic time logging. But when teams need to analyze how work flows through each stage, uncover bottlenecks, or optimize delivery pipelines, those features quickly fall short.
Here's why:
-
No visibility into status-to-status flow – You can’t see how long tasks sat “In Review” vs “Blocked” vs “In Progress.”
-
No historical time snapshots – Once the issue is resolved, it’s hard to recreate what happened and when.
-
Manual effort and JQL complexity – Getting detailed time insights often means custom scripts or Excel exports.
-
One-size-fits-all reports – Different teams (Dev, QA, Support, Product) have different metric needs—but native Jira reports can’t be easily tailored.
Comparison Table: Jira Native vs Time Metrics Tracker
| Feature |
Jira Native Tracking |
Time Metrics Tracker |
|---|
| Time Spent per user |
✅ |
✅ |
| Time per Status |
❌ |
✅ |
| Cycle Time / Lead Time |
❌ |
✅ |
| SLA & Response Metrics |
❌ |
✅ |
| Custom Status-to-Status Reports |
❌ |
✅ |
| Dashboard Gadgets |
Basic only |
✅ Advanced |
| Saved Views for Reuse |
❌ |
✅ |
| Calendar Configuration (Workdays/Holidays) |
❌ |
✅ |
| Export for Analysis (XLS, CSV, BI tools) |
Manual |
✅ One-click |
| Visual Reports (Grid, Scatter, Histogram) |
Limited |
✅ |
Time Metrics Tracker | Time Between Statuses brings visibility to your processes by capturing how long tasks spend in each Jira status or transition.
🕒 Key Metrics You Can Track
| Metric |
What It Shows |
Who Needs It |
|---|
| Cycle Time |
Time from work started to done |
Dev teams, QA |
| Lead Time |
Full journey from ticket creation to completion |
PMs, stakeholders |
| Time in Status |
Duration spent in each Jira status |
Project managers |
| Blocked Time |
Time spent in “Blocked” or similar statuses |
DevOps, QA |
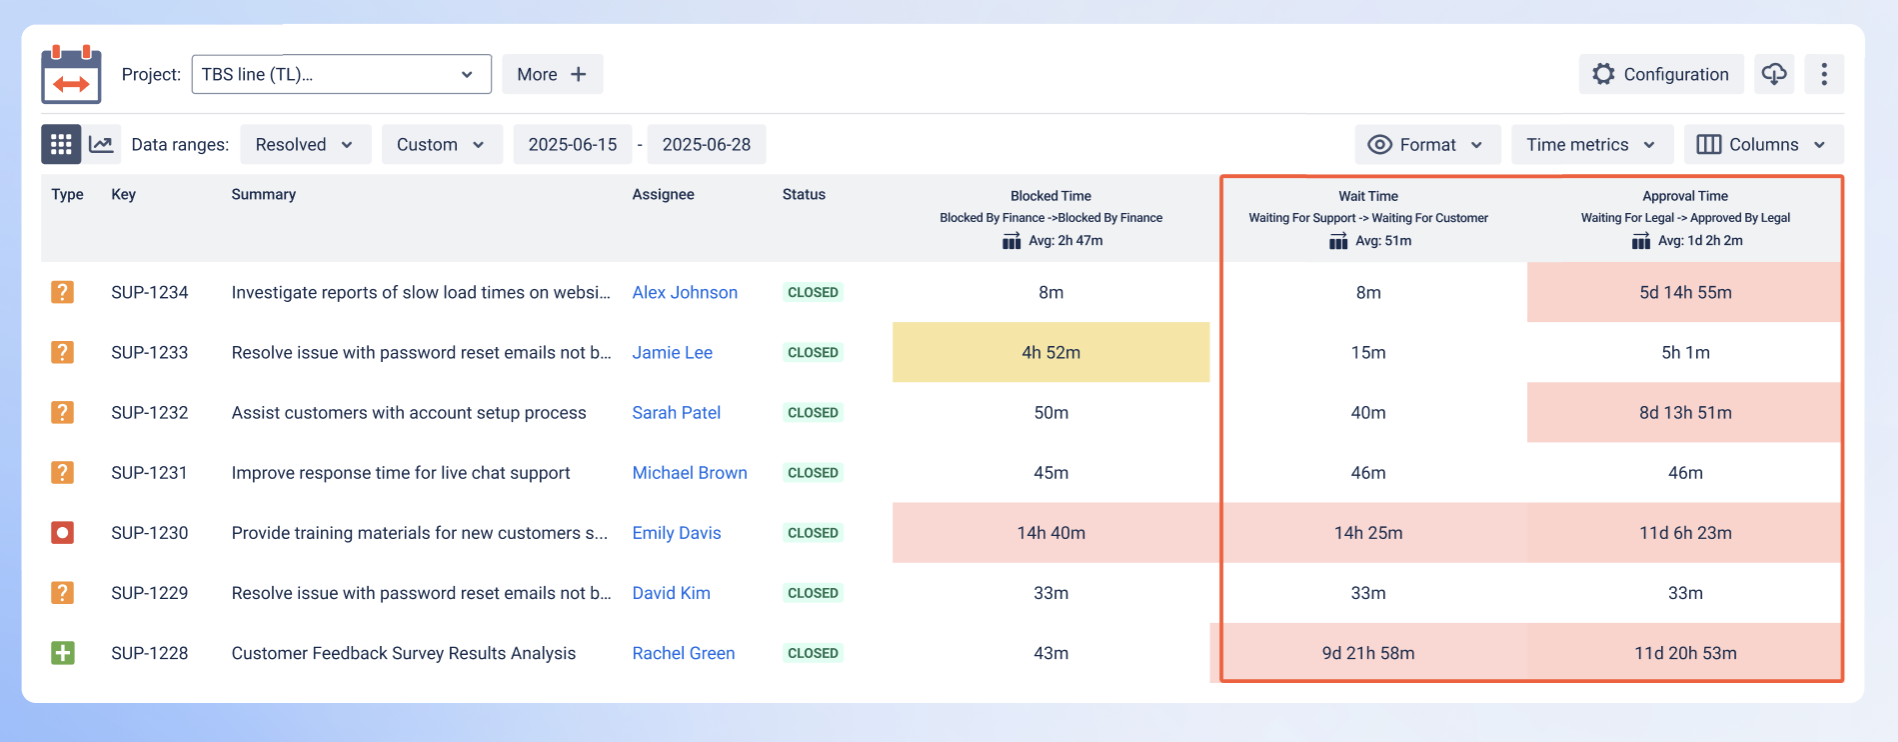
| Wait Time |
Time waiting on customer, vendor, or internal approval |
Support, Procurement |
| Approval Time |
Time between “Ready for approval” → “Approved” |
Compliance, Procurement |
| First Response Time |
Time from creation to first action |
Support, SLA reporting |
| Rework Time |
Time spent in repeated statuses |
Agile coaches, Scrum Masters |
What Time Metrics Tracker Helps You Uncover
✅ Which stages cause delays: See if issues pile up in “In Review,” “Waiting for Approval,” or bounce between statuses.
✅ Which teams are overloaded: Use filters by assignee or role to spot workload imbalance.
✅ Where processes need improvement: Long Cycle Time with short Dev Time? Your reviews or handoffs need help.
✅ How much rework is being done: See multiple entries into the same status and measure the total time there.
✅ How responsive your support is: Track First Response and SLA compliance over time.
Use Cases
🔧 Developers & QA
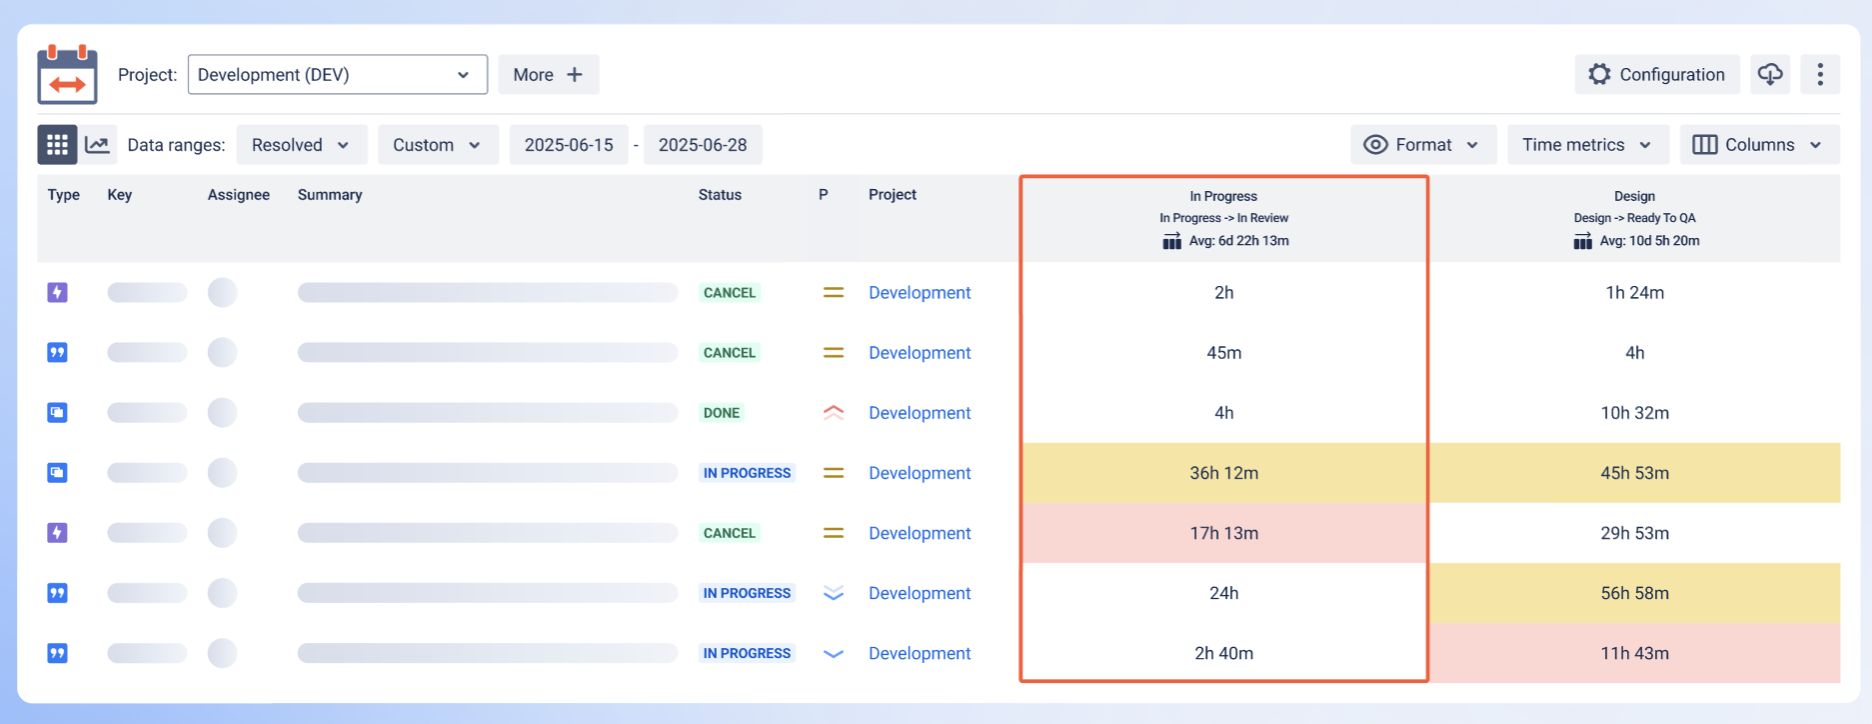
💼 Project Managers
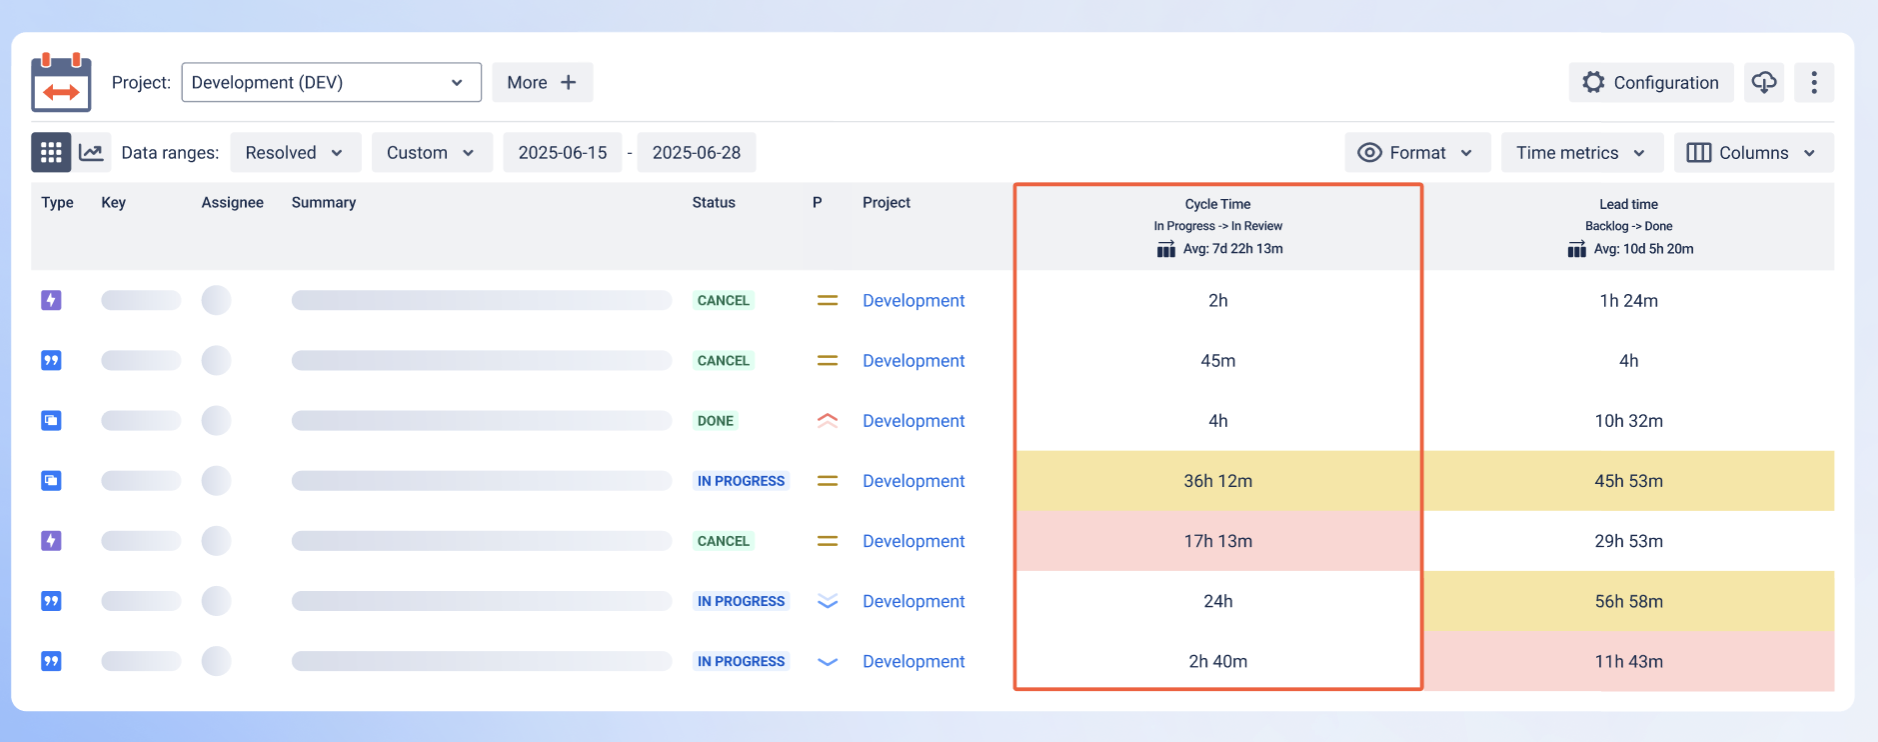
-
Report on true delivery speed with Cycle Time, Lead Time
-
Monitor each phase of the workflow with Time in Status
🛒 Procurement Teams
From Raw Data to Real-Time Insights
With Time Metrics Tracker, you get:
-
Visual reports – Scatter plots, grids, and histograms that show how work flows (or stalls).
-
Saved Views – Create reusable report views for QBRs, retros, or leadership updates.
-
Status Groups – Combine statuses (like “Waiting for Customer” + “Blocked”) into broader delay categories.
-
Multi-calendar support – Reflect true working hours, holidays, or regional schedules.
Final Thought
Native Jira time tracking gives you the “what.”
Time Metrics Tracker | Time Between Statuses gives you the why and where.
In an era where every sprint, project, or SLA matters, understanding how your work moves—or doesn’t—is essential. If you're tired of spreadsheets, manual JQL, or disconnected insights, it’s time to let Time Metrics Tracker surface the truth behind your delivery process.
🔗 Try Time Metrics Tracker on the Atlassian Marketplace
📚 Learn more about use cases → Product Wiki
