“We spent more time preparing reports than discussing results.” Sound familiar?
If your team is preparing Quarterly Business Review (QBR) data from Jira, chances are you're stuck in a tedious loop: exporting data, massaging spreadsheets, reapplying filters, and chasing down team leads for answers. All of that, before you even start making decisions.

But it doesn’t have to be this way.
In this article, we’ll explore:
-
The most common mistakes teams make when preparing for QBRs in Jira
-
What metrics you should focus on
-
How Time Metrics Tracker | Time Between Statuses + Dashboards can automate and simplify the process
-
Real-world examples: Cycle Time and SLA Compliance
The Problem: Drowning in Jira Spreadsheets
Let’s be honest: Jira isn’t exactly QBR-ready.
Most teams preparing for quarterly reviews follow a familiar path:
🚫 Common Pain Points
| Mistake |
Problem |
|---|
| Manual exports from Jira |
Data is outdated the moment you export it. |
| Copy-pasting into spreadsheets |
Prone to human error and version chaos. |
| No standard metrics |
Each team shows different KPIs, leading to confusion. |
| Time-consuming filtering |
Filters need to be rebuilt every QBR, wasting hours. |
| No big-picture view |
You can’t easily see trends, bottlenecks, or patterns. |
As a result, QBRs turn into reporting reviews, not business insights sessions.
The Solution: Time Metrics Tracker + Jira Dashboards
Time Metrics Tracker is a Jira add-on that transforms time-in-status data into clear, actionable metrics — and makes them visible on Jira dashboards.
It replaces the “export + spreadsheet + chart + hope” workflow with a seamless Jira-native setup.
✅ What Time Metrics Tracker Adds to Jira:
-
Custom time metrics (Cycle Time, Lead Time, Resolution Time, SLA, etc.)
-
Gadgets for Jira Dashboards: see trends without leaving Jira
-
Saved Views for consistent quarterly reports (no need to rebuild filters)
-
Export to XLS/CSV only when you want to (not because you have to)
What Metrics Matter in QBRs?
If you're unsure which metrics to present, here are two essential ones that cover both delivery performance and service quality:
📈 Case 1: Cycle Time – Proving Development Efficiency
Definition:
Cycle Time measures how long it takes from the moment work starts (e.g., "In Progress") to when it’s completed (e.g., "Done").
🧠 Why it matters:
-
Indicates delivery speed and workflow efficiency
-
Helps identify bottlenecks like dev overload, unclear requirements, or review delays
-
Shows improvements over time (or not)
✅ With Time Metrics Tracker:
-
View Cycle Time per assignee, sprint, or label on dashboards
-
Use scatter plots to visualize outliers (long-running tasks)
-
Save views like "Cycle Time by Sprint Q1 vs Q2" to track progress without manual setup
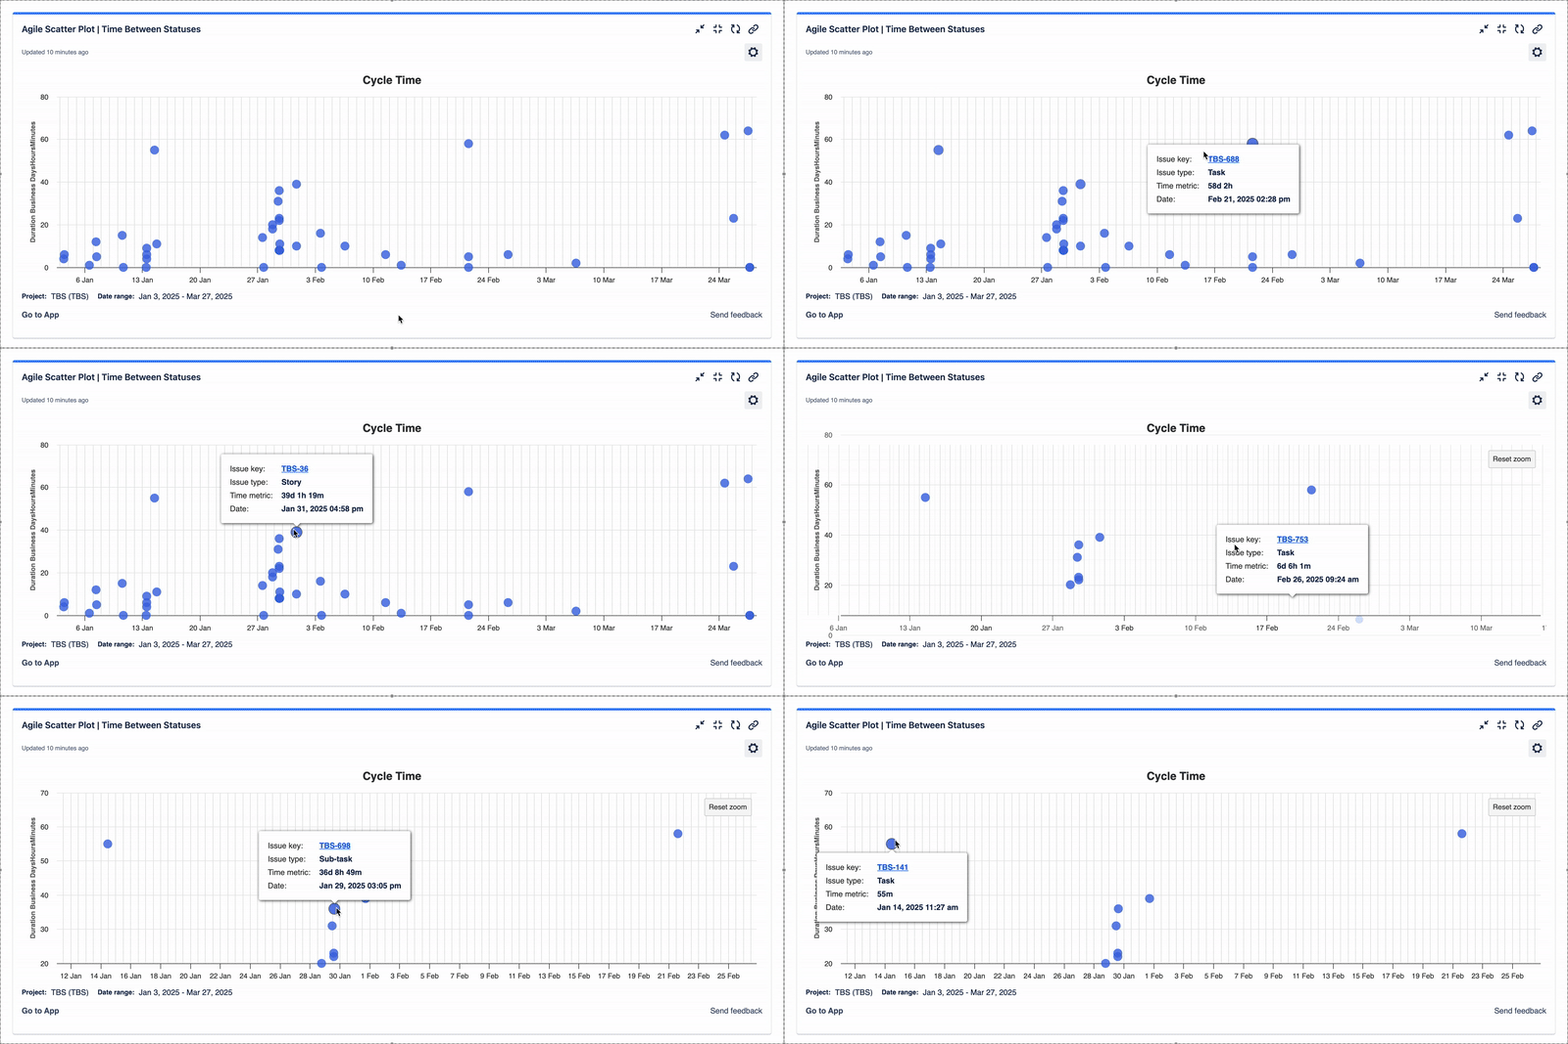
📊 Real QBR Insight:
“Average Cycle Time decreased by 25% this quarter after we introduced WIP limits.”
🛎 Case 2: SLA Compliance – Measuring Support & Service Quality
Definition:
SLA metrics track your team’s ability to respond or resolve tickets within a promised time frame.
🧠 Why it matters:
-
Key metric for support, ITSM, DevOps, and regulated industries
-
Missed SLAs = missed customer expectations
-
Helps justify team size, ticket volume, and tool improvements
✅ With Time Metrics Tracker:
-
Track Resolution Time, First Response Time, and other SLA metrics
-
Visualize breaches and delays on Jira Dashboards
-
Use Saved Views to present SLA trends at each QBR
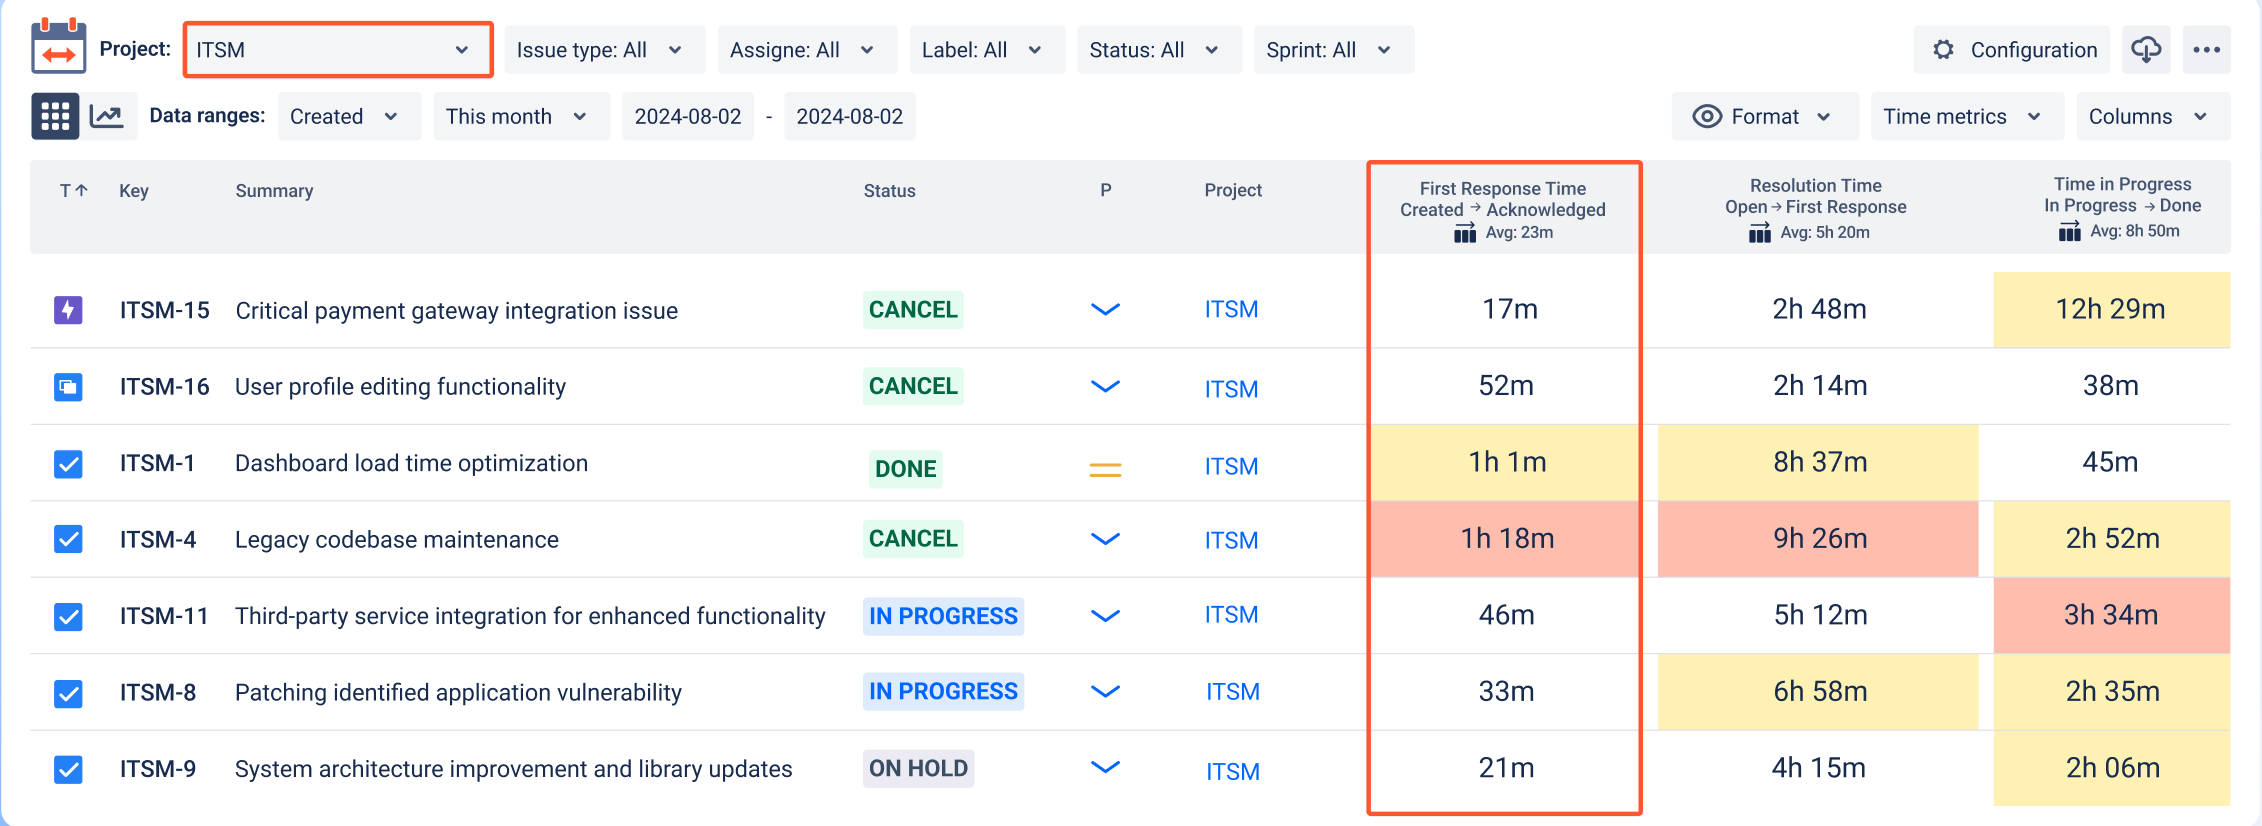
📊 Real QBR Insight:
“Only 62% of tickets met SLA last quarter — delays were mostly due to handoffs to external teams.”
How to Stop Rebuilding Reports Every Quarter
🧰 Use Saved Views in Time Metrics Tracker
Saved Views allow you to:
-
Lock in filters (e.g., by team, sprint, label)
-
Use the same metric definitions every quarter
-
Compare Q1 → Q2 without extra work
-
Share views with execs or cross-functional leads
🖥️ Add Gadgets to Jira Dashboards
Dashboards bring your QBR metrics to life — directly inside Jira.
Time Metrics Tracker supports:
-
Average Cycle/Lead Time by Assignee or Sprint
-
Scatter Plots to highlight issue spikes
-
Tables with SLA Compliance Rates
-
Custom Time Metrics (e.g., time between "Ready for QA" and "Done")
Summary: Turn Reporting into Insight
| Without Time Metrics Tracker |
With Time Metrics Tracker |
|---|
| Manual exports to Excel |
Reports stay inside Jira |
| Filters rebuilt every time |
Filters saved & reused |
| Inconsistent data |
Standardized time metrics |
| Hours wasted on formatting |
Dashboards update in real-time |
| Guessing what happened |
Clear, visual patterns |
Final Thought
QBRs shouldn’t start with chaos — they should start with clarity.
Use Time Metrics Tracker | Time Between Statuses to stop drowning in Jira data and start leading with insights. Whether you're tracking development efficiency, SLA compliance, or delivery predictability — Time Metrics Tracker gives you a repeatable, accurate, and powerful way to own your team’s story.
Ready to make QBRs effortless?
👉 Time Metrics Tracker | Time Between Statuses
