Jira helps marketing teams plan campaigns, assign work, and keep launches moving. Google Analytics 4 (GA4) helps measure what happens after people arrive on your website or app.
To connect the two, start with a shared campaign name, a reliable analytics report, and a regular review. Then use the results to decide what your team should work on next.
What Are Metrics in Google Analytics 4?
In GA4, a metric is a number that measures something about user behavior, traffic, or business outcomes. Think of them as the answers to “how many” or “how much” questions.
- How many people visited your site? → Users
- How many times was a video played? → Event count
- How much revenue did a campaign generate? → Revenue
Metrics are always quantitative. They pair with dimensions (the “descriptions” like campaign name, channel, or device) to give you context. For example: 1,200 new users (metric) came from LinkedIn Ads (dimension).
This distinction is important because campaign analysis is about more than numbers — you need to know where they come from and what they mean.
1. Acquisition Metrics (which campaigns bring people to your site?)
- Users – How many people interacted with your site/app via a campaign.
- New users – Share of fresh audiences vs returning ones.
- Sessions – How many visits campaigns generated.
- Traffic acquisition: Source/medium/campaign – UTM-based tracking to see which channels and campaigns bring the traffic.
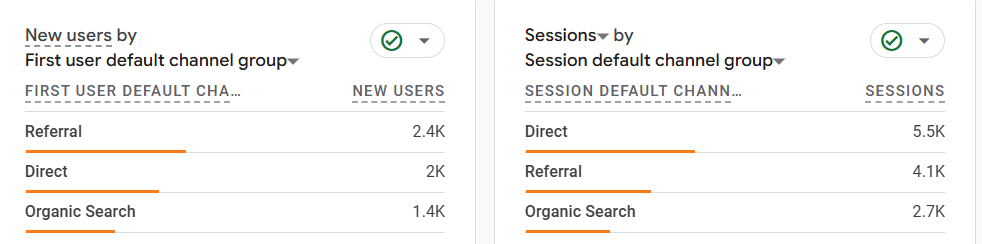
Why it matters: Acquisition metrics show if your campaigns are reaching the right audiences and through which channels.
💡 Example: A company launches a LinkedIn ad campaign targeting product managers. GA4 shows 1,200 new users and 500 returning users. The high ratio of new users signals the campaign is working well for brand awareness.
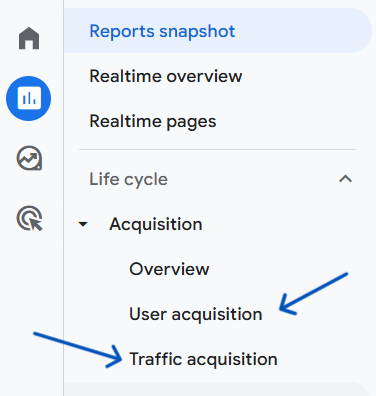
User Acquisition vs. Traffic Acquisition in GA4
This is one of the most common points of confusion in GA4, especially when evaluating campaigns.
- User Acquisition
- Measures where a user first came from.
- Uses dimensions like First user source/medium/campaign.
- Always tied to the very first session a user had with your site or app.
- Example: If someone first discovers you via a LinkedIn ad, that’s their “first user source,” even if they later return via Google search.
- Traffic Acquisition
- Measures where each session came from.
- Uses dimensions like Session source/medium/campaign.
- Tied to the current visit/session, regardless of prior history.
- Example: That same user’s later visit through a Google search ad would show up under Google / CPC in Traffic Acquisition, even though they first came via LinkedIn.
👉 The difference in one line:
- User Acquisition = Where did this user first come from?
User Acquisition is the first handshake, while Traffic Acquisition is the door they walked through today.
2. Engagement Metrics (what happens after the click?)
- Engagement rate – % of sessions that were truly “engaged” (longer than 10s, multiple pageviews, or a key event).
- Average engagement time per session – How much attention your campaign traffic gives.
- Engaged sessions per user – Indicates repeat interest.
- Event count for campaign CTAs – Clicks, downloads, or video plays tied to campaign goals.
Why it matters: Traffic means little without interaction. Engagement metrics reveal if your targeting and messaging resonate.
💡 Example: An email campaign with 2,000 visitors and a 60% engagement rate outperforms a social ad with 10,000 visitors but only 20% engagement.
3. Key Events (are visitors taking meaningful actions?)
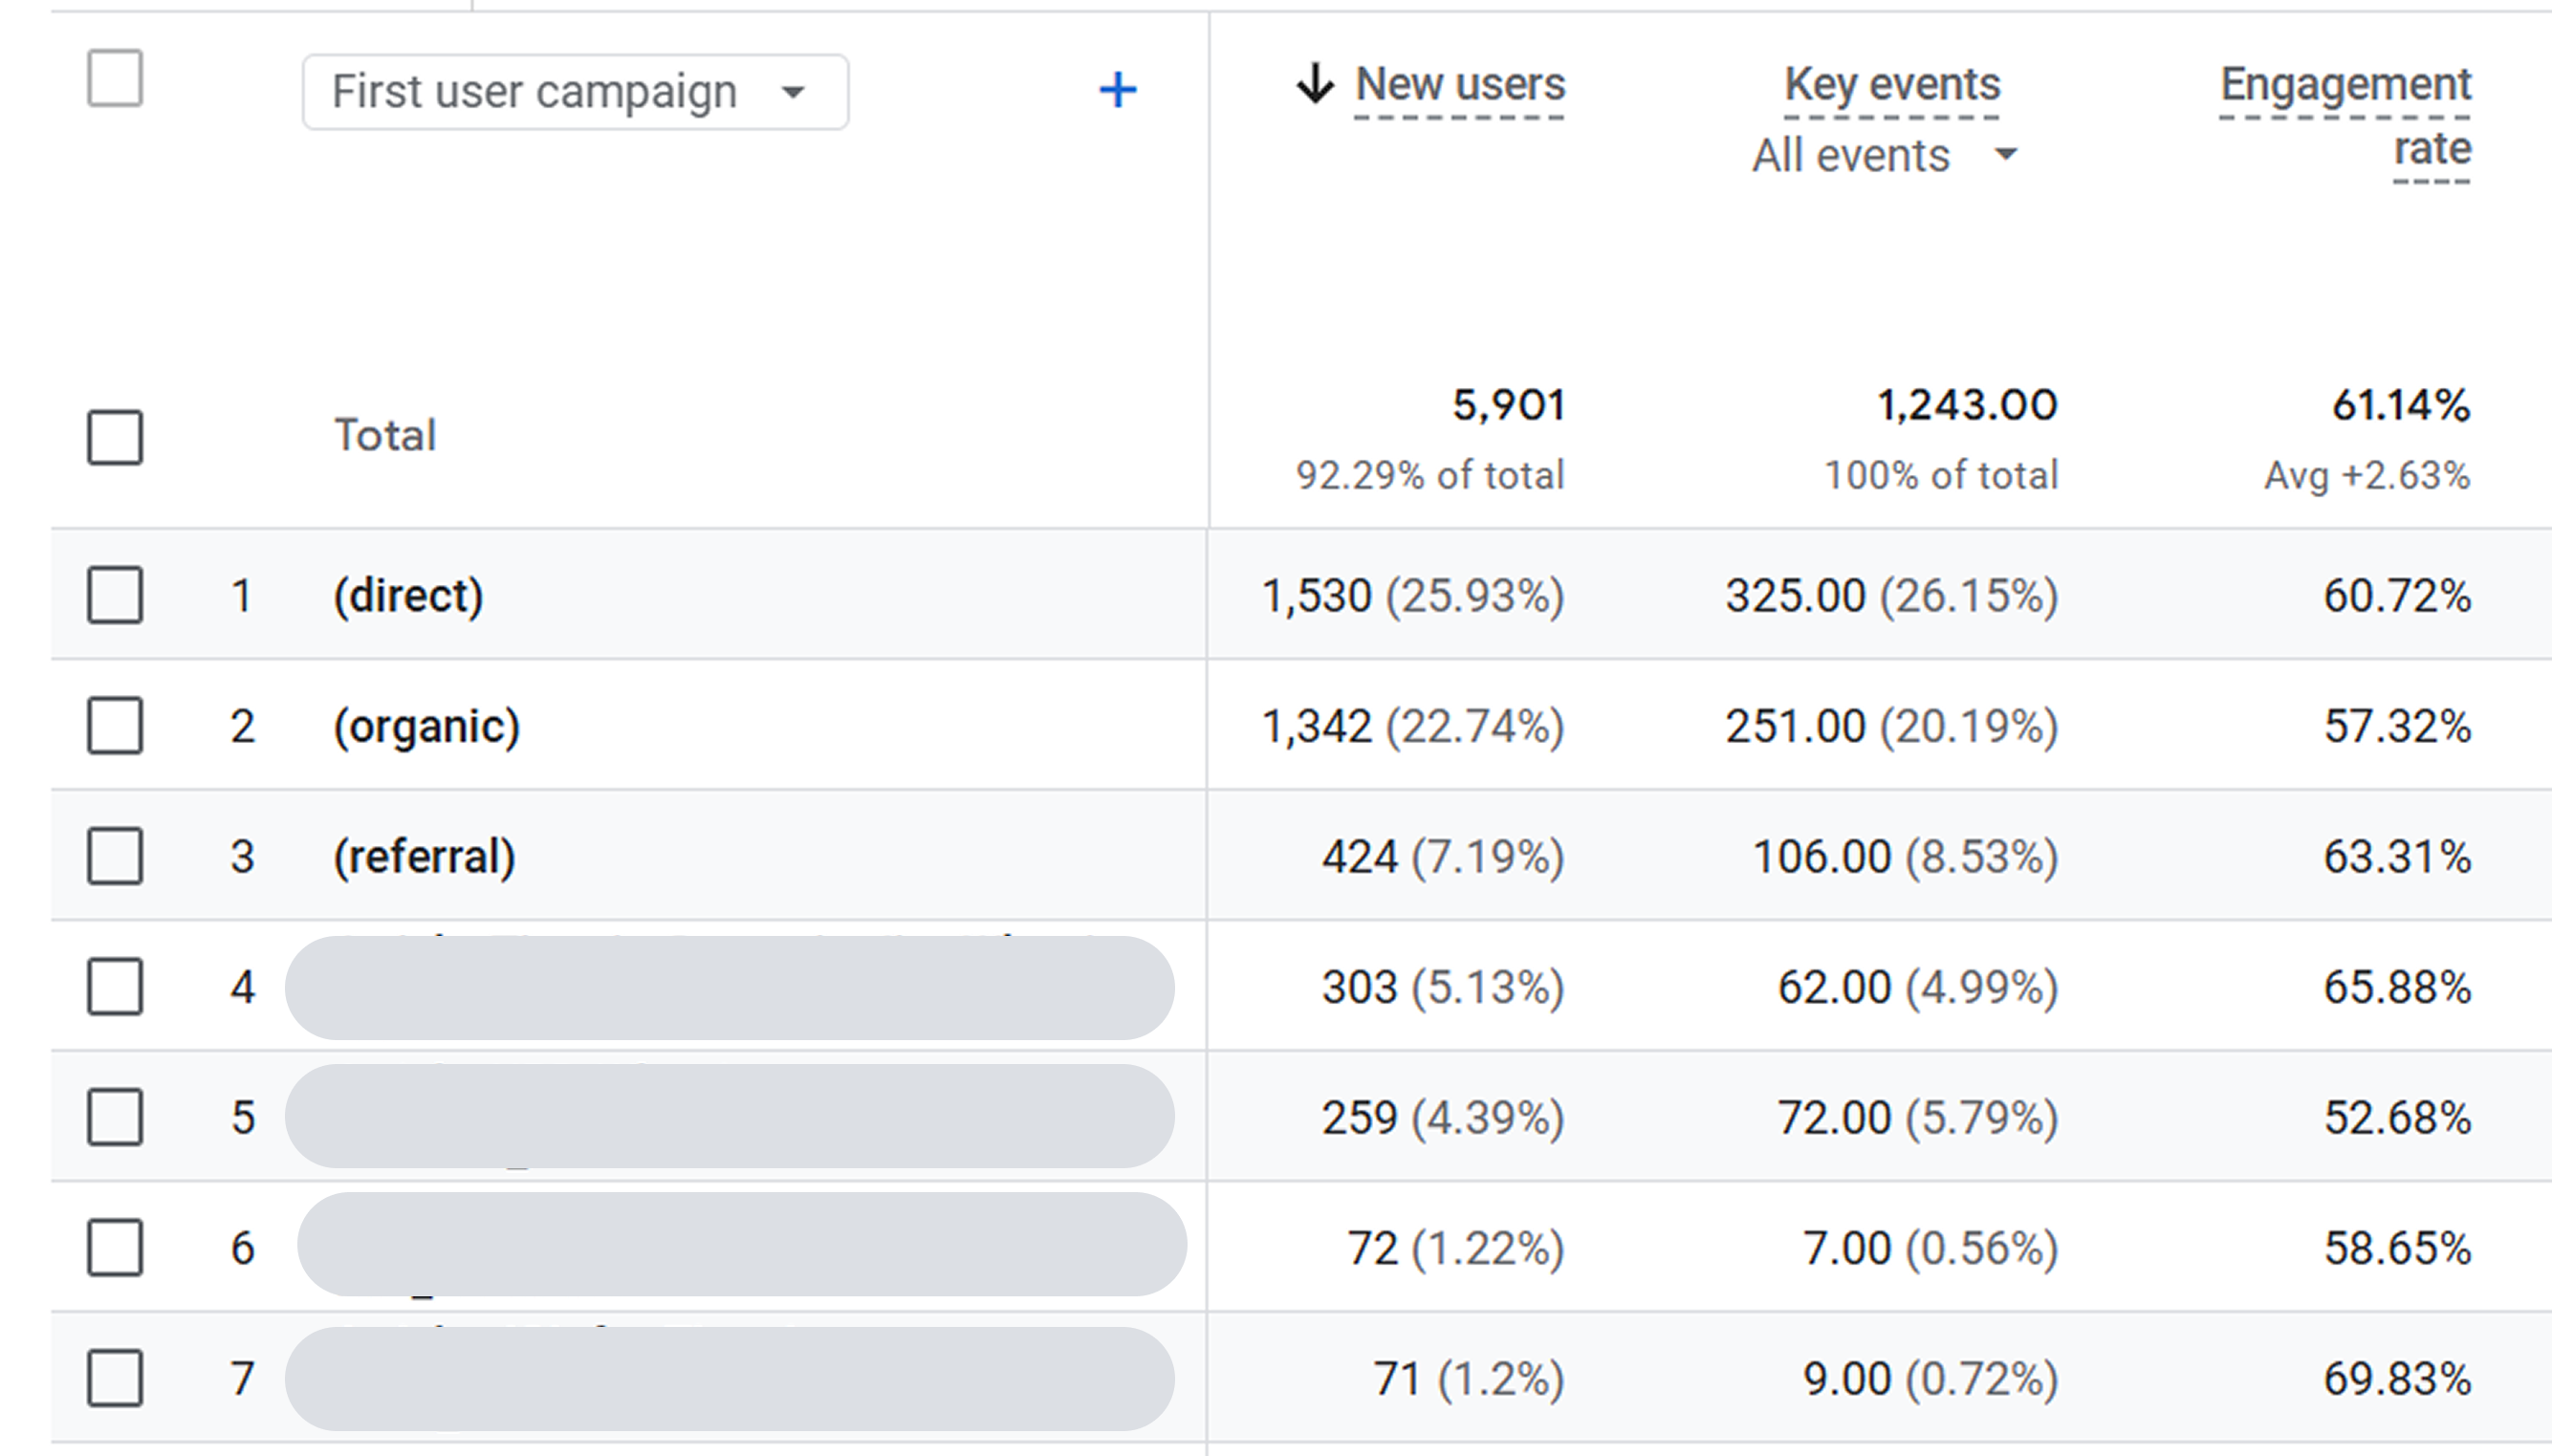
Mark events that matter to your business as key events, such as a successful sign-up or demo request. Track:
- Key events: the recorded count for the selected important action.
- Session key event rate: the percentage of sessions in which a key event occurred.
- User key event rate: the percentage of users who triggered a key event.
Select the specific key event you want to evaluate. Combining downloads, demo requests, and purchases into one success measure can hide meaningful differences. Metric definitions are available in Google’s Analytics Data API schema.
Use key events for standard GA4 behavioral reporting. Conversions have a separate role in advertising measurement and can be created from Analytics events for Google Ads. Google is also expanding conversion-based cross-channel reporting in the Advertising section; availability can differ by property. See About key events and Google’s cross-channel measurement update.
💡 Example: A webinar generates fewer sign-ups than a downloadable guide, but more of those leads become customers. Assess lead quality using CRM or subscription data alongside GA4; GA4 only reports the downstream outcomes your measurement setup captures.
4. Revenue and return: does the campaign justify its cost?
Where revenue tracking is implemented, review purchase revenue or total revenue, choosing the metric that matches your business model. Total revenue can include purchases, subscriptions, and advertising revenue, with refunds accounted for. See Google’s revenue metric definitions.
Revenue alone is not ROI. To evaluate spend, distinguish:
- ROAS: attributed advertising revenue divided by advertising spend.
- Campaign ROI: a calculation using your agreed profit and full campaign-cost definition, including relevant production, agency, and team costs.
GA4 needs appropriate revenue and cost data to support advertising-return reporting. UTM tags alone do not supply campaign costs. Check your linked advertising accounts or cost imports and the selected report’s definitions.
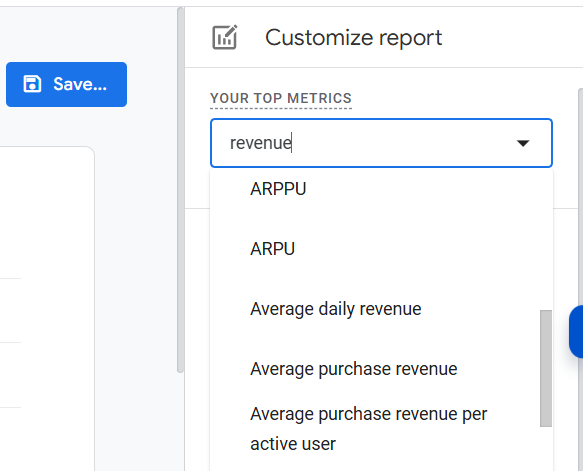
💡Example: $3,000 in attributed revenue from $1,000 in ad spend gives a 3× ROAS. That does not mean a $2,000 profit: other costs still need to be considered.
5. Attribution Metrics (which touchpoints receive credit?)
Acquisition reporting describes how users and sessions were acquired. Attribution reporting assigns credit for important outcomes across eligible touchpoints.
Data-driven attribution can distribute fractional credit based on the available data. It does not guarantee that every touchpoint receives credit or that every interaction was observed. Check the reporting attribution model and lookback window before comparing results.
For manually tagged campaign links, use consistent utm_source, utm_medium, and utm_campaign values. Add utm_content to distinguish creatives where useful. Supported advertising integrations also provide auto-tagging, so manual UTMs are not the only source of acquisition information.

Why it matters: Campaigns rarely convert on the first touch. Attribution shows how channels support each other across the funnel.
💡 Example: A user discovers you through a YouTube ad, clicks an email, then converts via search. GA4 attribution ensures all three get credit.
✅ Pro tip for campaign analysis: Always use UTM tags (utm_source, utm_medium, utm_campaign, utm_content) on campaign links. Without them, GA4 cannot properly attribute traffic and conversions to your campaigns.
How to use GA4 insights in Jira
You can connect campaign results with delivery work through a linked report and a short, dated summary.
1. Create a campaign record
Use a Jira epic or work item as the campaign’s home. Record the owner, objective, launch dates, landing page, primary key event, and exact campaign name used in your tracking.
2. Link the relevant analytics report
Add the GA4 report link to the campaign description. Document the property, date range, campaign filter, dimension scope, and selected key event so teammates can reproduce the analysis. Check that reviewers have access to the report.
3. Keep a dated performance summary
Update a short summary in the work item or on a linked Confluence page. A useful template is:
Field | What to record |
|---|
Reporting period | Dates, comparison period, and last updated date |
Campaign | Exact tracking name and report filter |
Acquisition | Sessions and new users, with their report scopes |
Engagement | Engagement rate and relevant interactions |
Outcome | Selected key event, count, and session key event rate |
Financial result | Revenue and cost, when available, with data sources |
Interpretation | What changed and what needs investigation |
Next action | Linked Jira work item, owner, and due date |
This summary is a manual snapshot. Linking a report does not automatically synchronize its metrics with Jira. For a broader campaign review, Confluence can also display linked Jira work items alongside the written results. See Atlassian’s guide to using Jira and Confluence together.
4. Turn findings into work
If sessions increase but demo requests do not, create a work item to investigate the landing page, form, or tracking. If a creative performs well against the campaign’s objective, create a follow-up task to test it with another audience.
Record the hypothesis and success measure before making the change. Review comparable periods and avoid attributing every movement in a metric to the latest edit.

Make campaign reporting actionable
Start with one campaign, one primary outcome, and a weekly review. Keep the analytics report linked to the work, record what you learned, and give the next action an owner. ("Track the work, see the results, celebrate the wins. 😉")
Which GA4 metric most often changes what your marketing team does next in Jira?


