The Dashboard Charts for Jira (Graphs, Tables, Reports) app (Jira Cloud) empowers you to build interactive, insightful dashboards using custom charts—turning your Jira instance into a hub of real-time analytics and clear visual storytelling. It’s a powerful addition for teams aiming to make data-driven decisions faster.
Key Features & Benefits
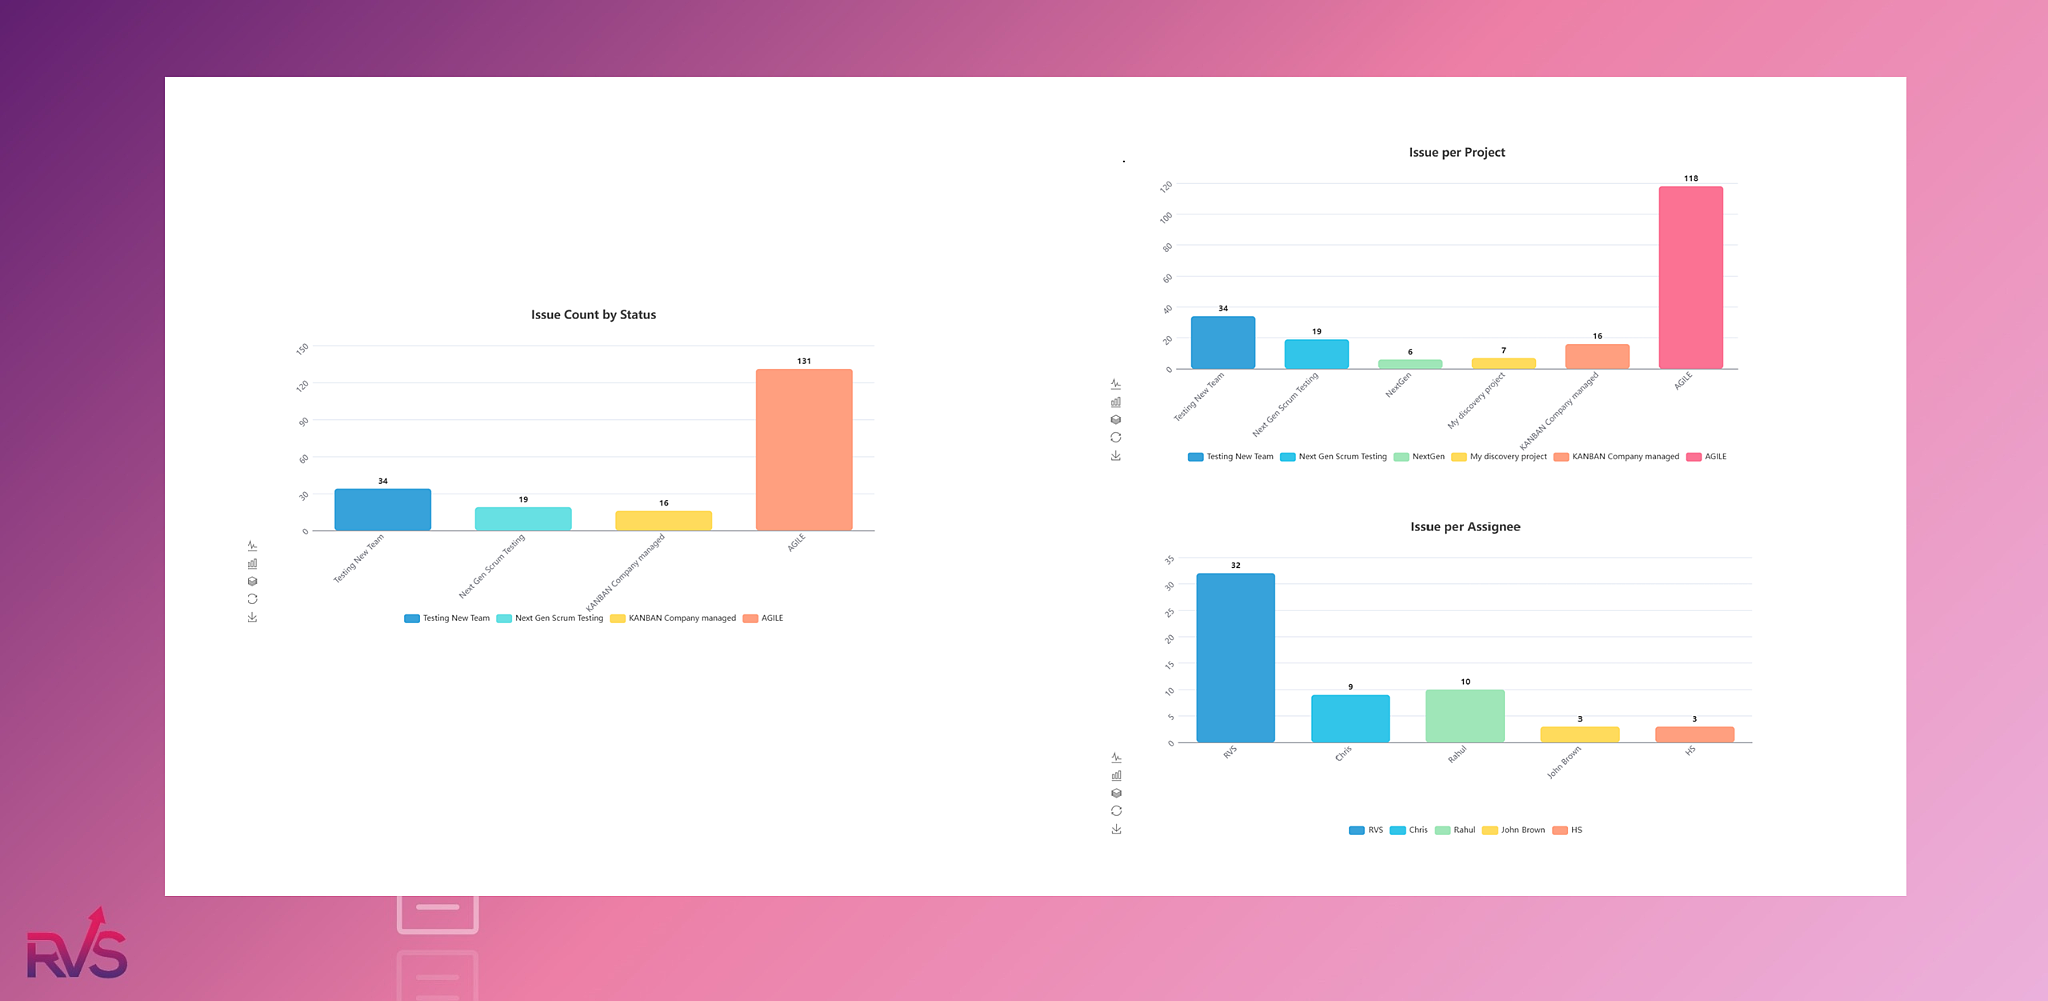
Custom Jira Dashboards & Charts
-
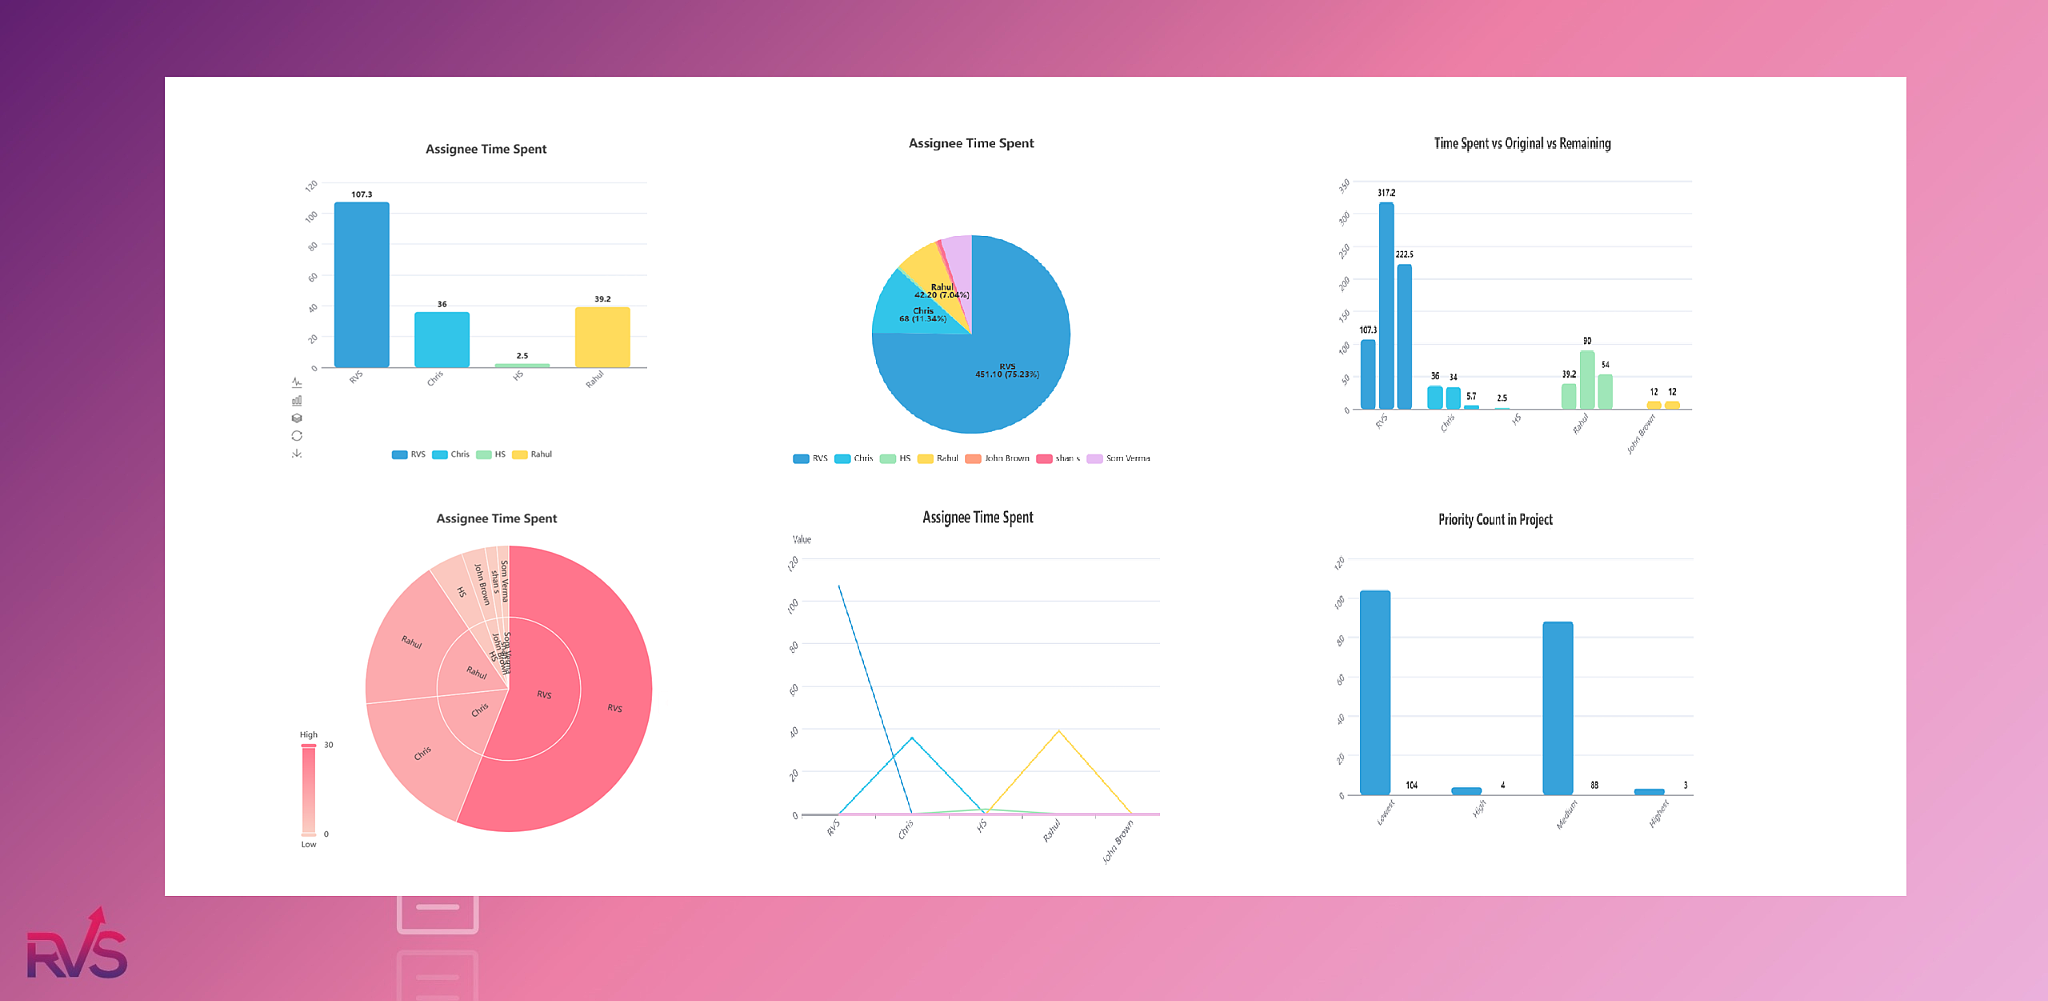
Build dashboards with dynamic, customizable bar charts, pie charts, trend graphs, and KPIs, with real-time updates.
-
Visualize issue progress, team workload, and project health at a glance.
Advanced Reporting Made Simple
-
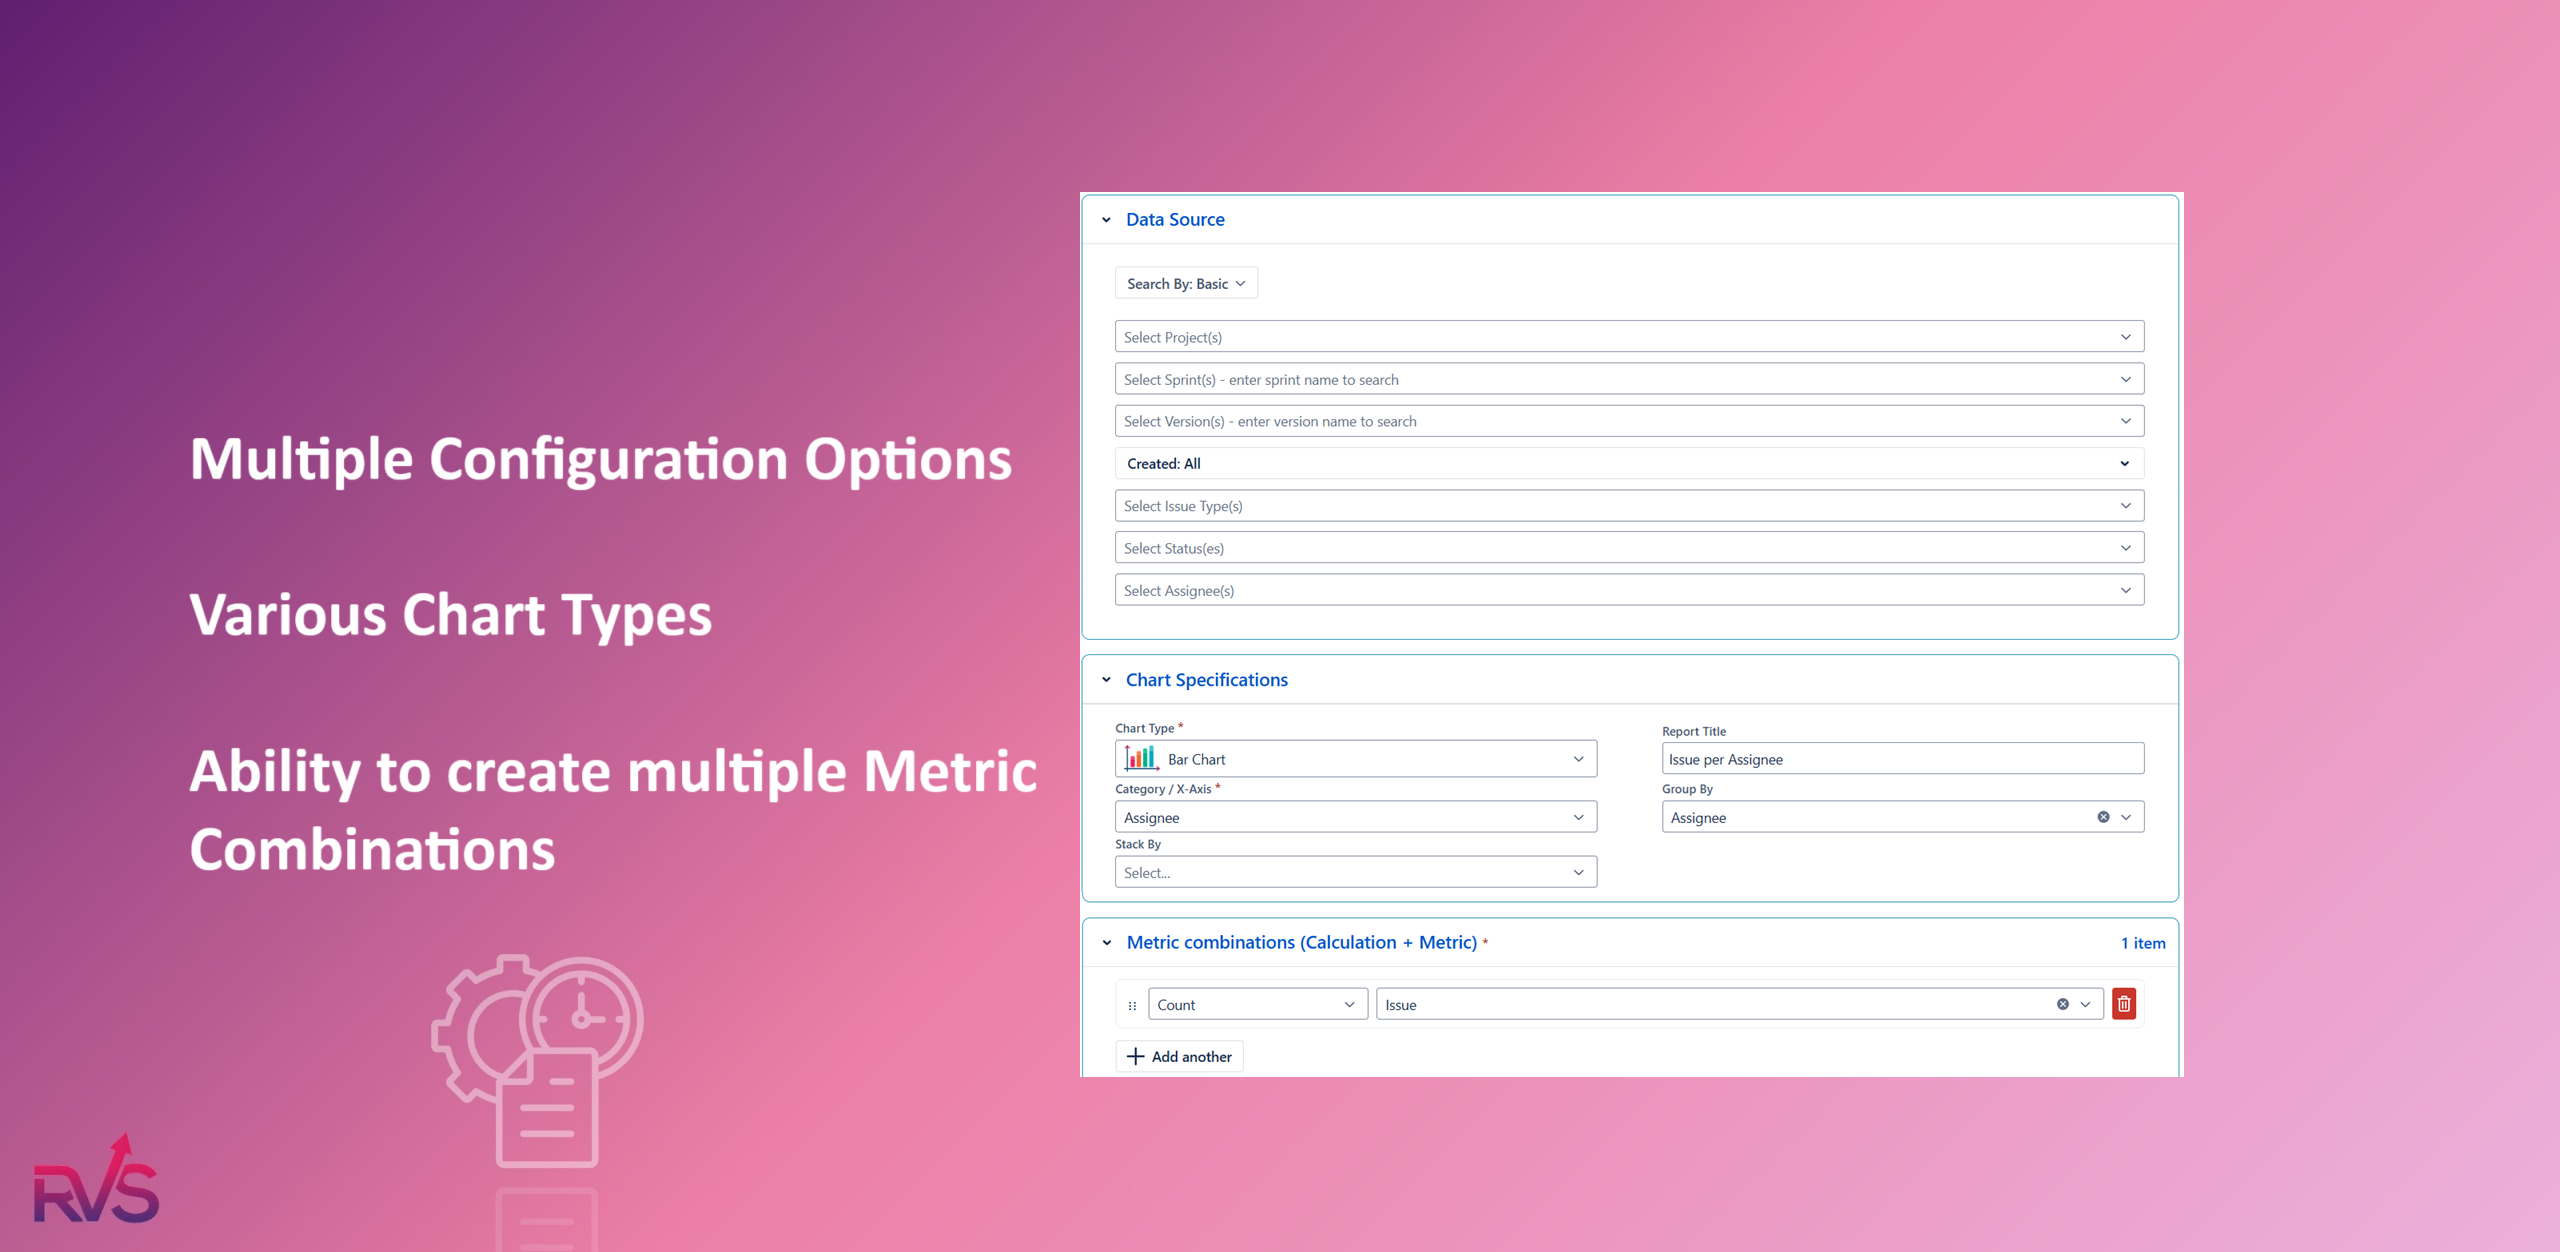
Create detailed reports via pie, bar, and trend charts.
-
Apply filters to tailor dashboards for different stakeholders.
-
Share instantly, ensuring teams stay aligned.
Data-Driven Project Tracking
-
Track sprint progress, flag bottlenecks, and optimize workflows.
-
Leverage custom chart gadgets to make sense of your Jira data and act upon it.
Easy Sharing & Collaboration
-
Share dashboards with teammates and stakeholders seamlessly.
-
Ideal for agile teams needing clarity and alignment across Scrum, Kanban, or hybrid methodologies.
Secure
When to Consider This App
| Scenario |
Use Case |
|---|
| Need richer visualization |
When Jira’s built-in gadgets (e.g., pie charts, created vs. resolved charts) don’t provide enough flexibility. |
| Tracking cross-project metrics |
Native gadgets struggle with team-managed projects and multi-project summaries. This app helps overcome those limitations. |
| Supporting Agile or Kanban workflows |
Use real-time dashboards to monitor sprint velocity, progress, cycle times, bottlenecks, etc. |
| Sharing insights externally |
Great for visual reports in Jira Service Management portals or with non-Jira stakeholders. |
App Highlights at a Glance
-
Interactivity: Customizable filters and drill-downs for dynamic dashboards.
-
No coding required: GUI-based setup makes it easy for non-technical users.
-
Collaboration-ready: Share dashboards across teams effortlessly.
-
Agile-friendly: Visualize and monitor Scrum/Kanban metrics in real time.
Getting Started & Tips
-
Install the app from Atlassian Marketplace (Cloud offering).
-
Navigate to your Jira Dashboard and click “Add Gadget”.
-
Locate the Dashboard Charts for Jira gadget and add it to your dashboard.
-
Select your chart type (bar, pie, line, etc.), apply filters or segments, and configure your data sources.
-
Share dashboards with teammates or stakeholders for collaborative insight.
Tips for Effective Use
-
Define your audience: Tailor dashboards to clarity—whether for executives, dev teams, or PMs.
-
Less is more: A clean layout with targeted metrics avoids overwhelming viewers.
-
Use filters smartly: Focus on what matters—e.g., specific sprints, teams, or issue types.
-
Refresh strategically: Use real-time updates to keep dashboards current without clutter.
Final Thoughts
Dashboard Charts for Jira offers a lightweight, and intuitive way to supercharge your Jira dashboards. If you’ve outgrown built-in reporting or need better visibility across sprints and projects, it’s worth exploring.
Let me know if you’d like help designing a dashboard tailored to your specific workflows or goals—happy to assist !! (support@rvsoftwares.in)
