Resource planning is often the dividing line between high-performing organizations and those struggling to keep up. At the core of effective capacity management is the ability to distinguish between workload and capacity—two concepts frequently mixed up, yet serving very different roles in planning.
This article explains how to strike the right balance between the two and how ActivityTimeline makes it possible.
Understanding the Difference: Workload vs. Capacity
Workload is the total estimated effort assigned to a resource over a set period—essentially the list of tasks, projects, and responsibilities on someone’s plate. It answers the question: What needs to be done?
Capacity is the benchmark against which workload is measured. It’s the actual time and energy someone can dedicate to work during that period. This goes beyond fixed working hours—it can be fine-tuned for each person or the whole organization, accounting for productivity patterns, skill levels, and variations in availability.
When workload and capacity are aligned, teams operate in a “sweet spot” where members are challenged but not overloaded—productive without burning out.
A 360° Dashboard for Resource Planning
ActivityTimeline acts as a central command center for teams and individuals, providing live insights into resource distribution across all projects. Its creators liken it to an orchestra: each person sees their own “sheet music” (tasks) and understands their role in the bigger performance (project timeline), while managers maintain a conductor’s perspective to ensure every section plays in harmony.
Visual Intelligence: The Workload Indicator System
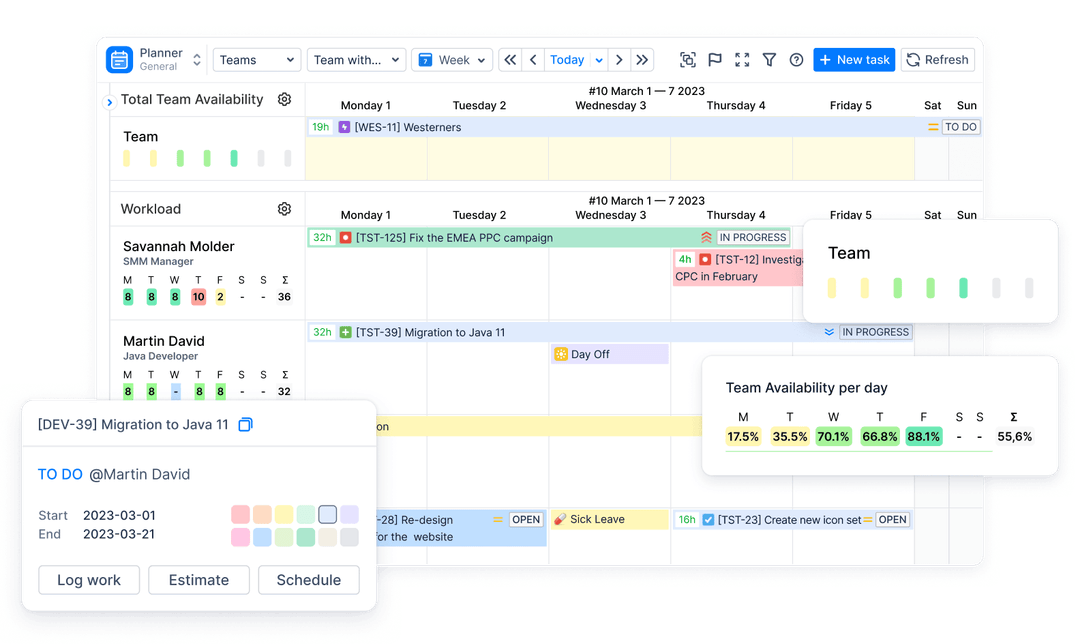
ActivityTimeline’s standout feature is its color-coded Workload Indicator, which turns complex allocation data into clear visual cues beneath each person’s name. It reflects assigned hours from tasks and events using intuitive colors:
-
Green – Balanced workload, optimal productivity
-
Olive – Underutilized, with room to take on more work
-
Yellow – Lightly loaded, potential to better leverage capacity
-
Light red – Slight overload; some tasks should be rescheduled
-
Red – Severe overload, exceeding realistic daily capacity
-
Blue – Out of office (vacation, sick leave, holiday)
-
Purple – Time off logged on weekends or holidays
-
Grey – Zero workload for the day

These color thresholds are fully customizable in the settings, and the indicator can display different modes: Workload, Availability, Number of Issues, or Worklogs + Workload.
Beyond Hours: Adapting to Story Points
Agile teams often estimate work in story points instead of hours—but story point values vary widely between teams. A task worth five points for one team might be twenty for another, complicating workload comparisons across projects.
Hours provide a universal baseline. ActivityTimeline bridges the gap with built-in conversion factors, which can be set globally or per project, ensuring accurate capacity tracking even when story point definitions differ.
Employee Autonomy: The Self-Managed Workload
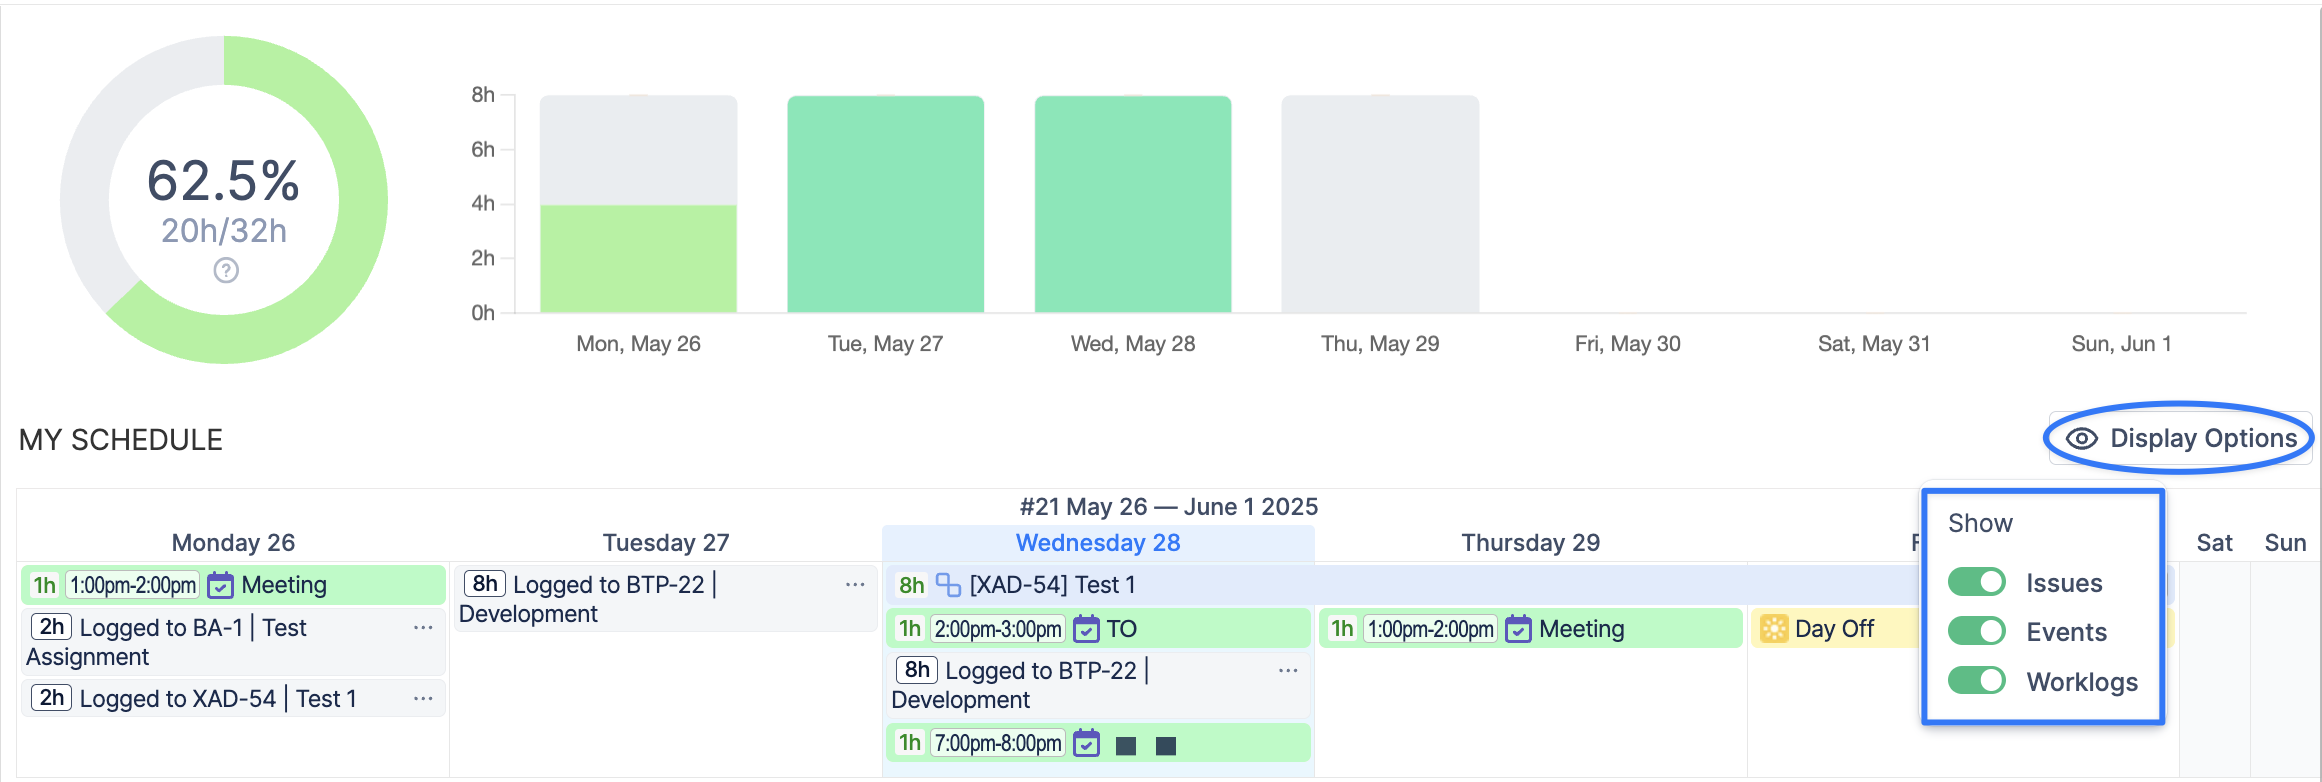
The Workspace module shifts control to employees, allowing them to actively manage their own schedules. Through a Personal Timeline, they can review assignments, adjust estimates, track progress, log time, and request time off. Multiple views and templates—Progress, Timeline, Detailed—help individuals monitor hours worked versus planned, and keep timesheets up to date.
Seamless Integration
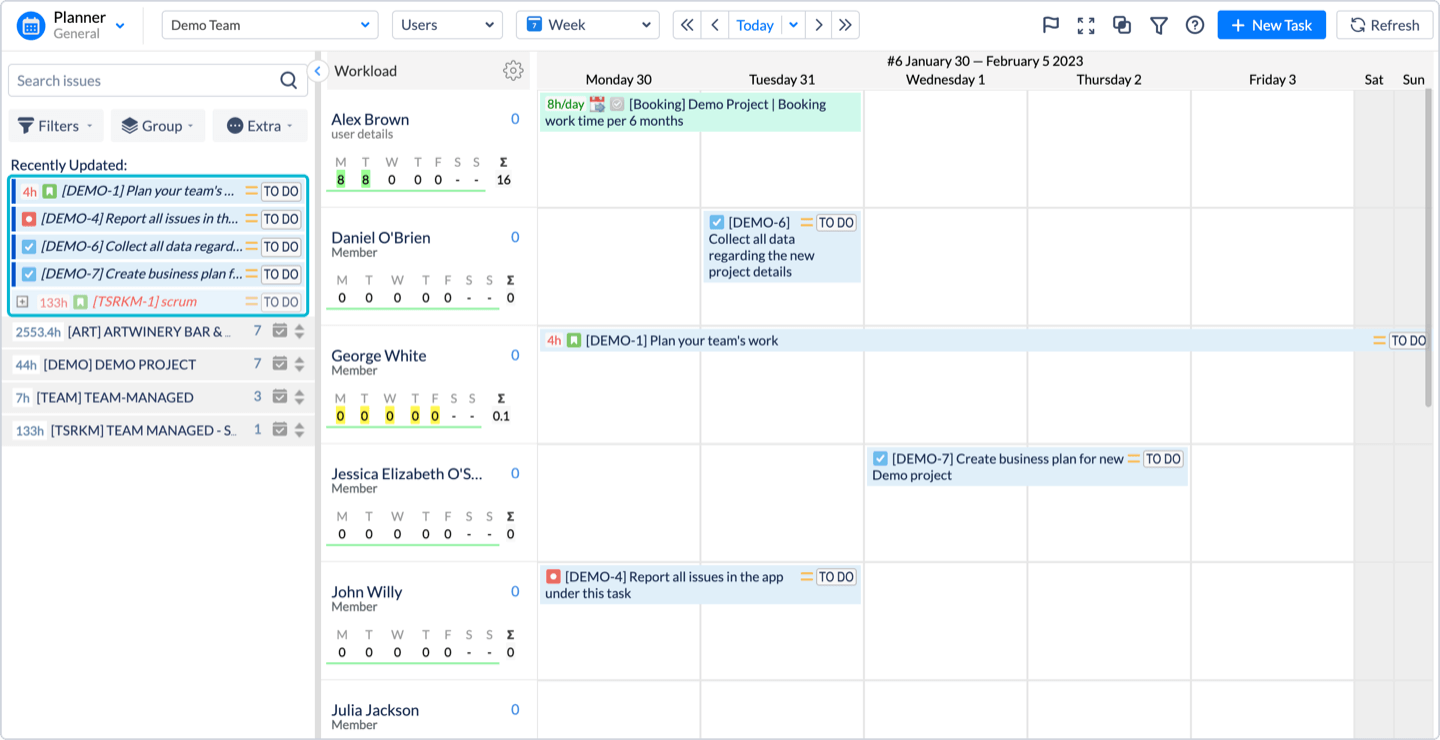
ActivityTimeline integrates directly with Jira, automatically pulling tasks into the Issue Panel for easy drag-and-drop scheduling. Issues can be sorted or filtered by person, project, priority, sprint, and more. Start/end dates update in Jira automatically to keep both systems in sync.
The platform also supports:
-
Booking – Reserve capacity without a Jira ticket
-
Time Off – Holidays, sick leave, or vacations (with approval flows)
-
Notes – Reminders without affecting capacity
-
Overtime – Temporary capacity boosts
-
Placeholders – Scenario planning without altering Jira tasks
Sprint-Centric Planning
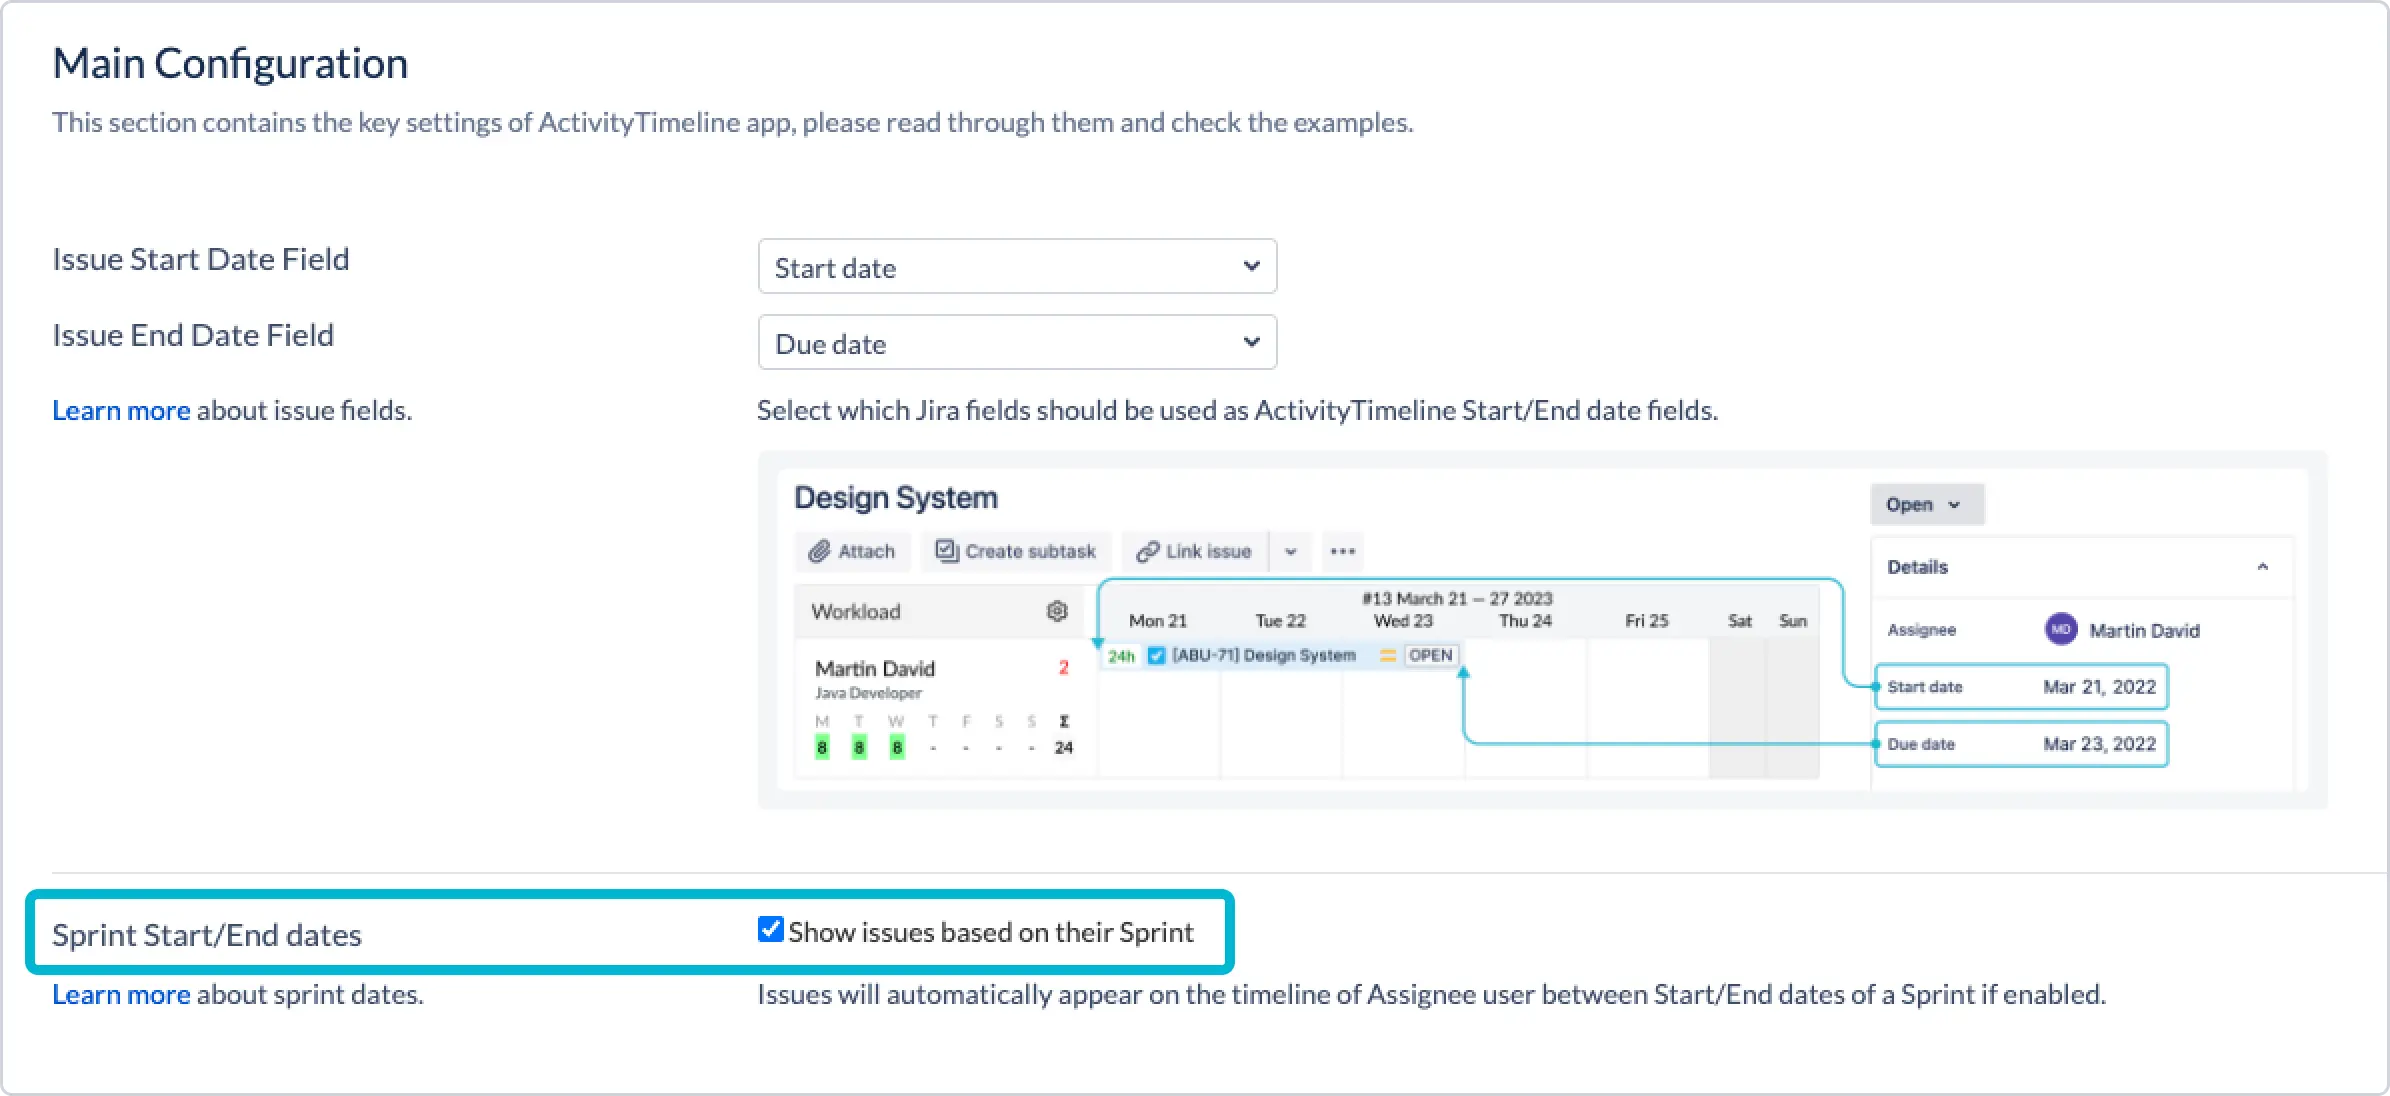
For agile workflows, Jira sprints appear automatically in ActivityTimeline’s Milestones Panel, with tasks assigned to the correct sprint dates. Drag-and-drop tools make sprint planning quick, and advanced settings let you prioritize sprint dates over individual issue dates when necessary.
Real-World Use Cases
1. The Product Launch Crunch
A project manager sees the lead developer flagged red—16 hours of work booked for an 8-hour day—while QA shows yellow. A quick drag-and-drop shifts code review tasks to available QA members, instantly balancing workload.
2. Agency Resource Shuffle
When a client suddenly speeds up a campaign, managers create “Overtime” entries for the week, then schedule “Day Off” events afterward to avoid burnout.
3. Seasonal Consulting Surges
Consulting firms adjust daily capacity for senior and junior staff during peak seasons, using story point-to-hour conversions to allocate work fairly.
4. Remote Team Coordination
A developer in Europe checks their Workspace first thing, resolves conflicts, and reprioritizes tasks before the US project manager logs in.
5. Knowledge Transfer Before Leave
Before vacation, a tech lead redistributes critical tasks using drag-and-drop, checking color indicators to ensure no one is overloaded.
The Bottom Line
ActivityTimeline delivers a win-win: organizations get improved resource utilization, fewer delays, and greater predictability; employees enjoy more control, healthier workloads, and reduced burnout.
As hybrid and remote work become standard, tools like ActivityTimeline aren’t just helpful—they’re essential to keeping teams connected, efficient, and sustainable.
