The limitations of the native Jira Sprint burndown chart
While the native Jira Sprint burndown chart offers a basic burndown-style graph, it lacks the advanced features Scrum teams need to thrive. 🤯 The native chart:
❌ Lacks velocity-based forecasting - unable to predict delivery dates based on team performance
❌ Offers no visual target lines - can't anchor progress to remaining work deadlines or milestones
❌ Provides no what-if scenario support - can't simulate custom velocity or delivery targets
❌ Has limited visualization - no cumulative tracking, forecast ranges, or multiple projection paths
Powerful alternative: Jira Sprint burndown chart by Broken Build
The Jira Sprint burndown chart by Broken Build is a simple yet highly configurable solution that fills the gaps left by Jira's native reporting tools. It provides Scrum teams with a centralized, real-time view of their sprint progress, allowing them to track, forecast, and adjust their plans with confidence.
Jira Sprint burndown chart: Key features & JTBD
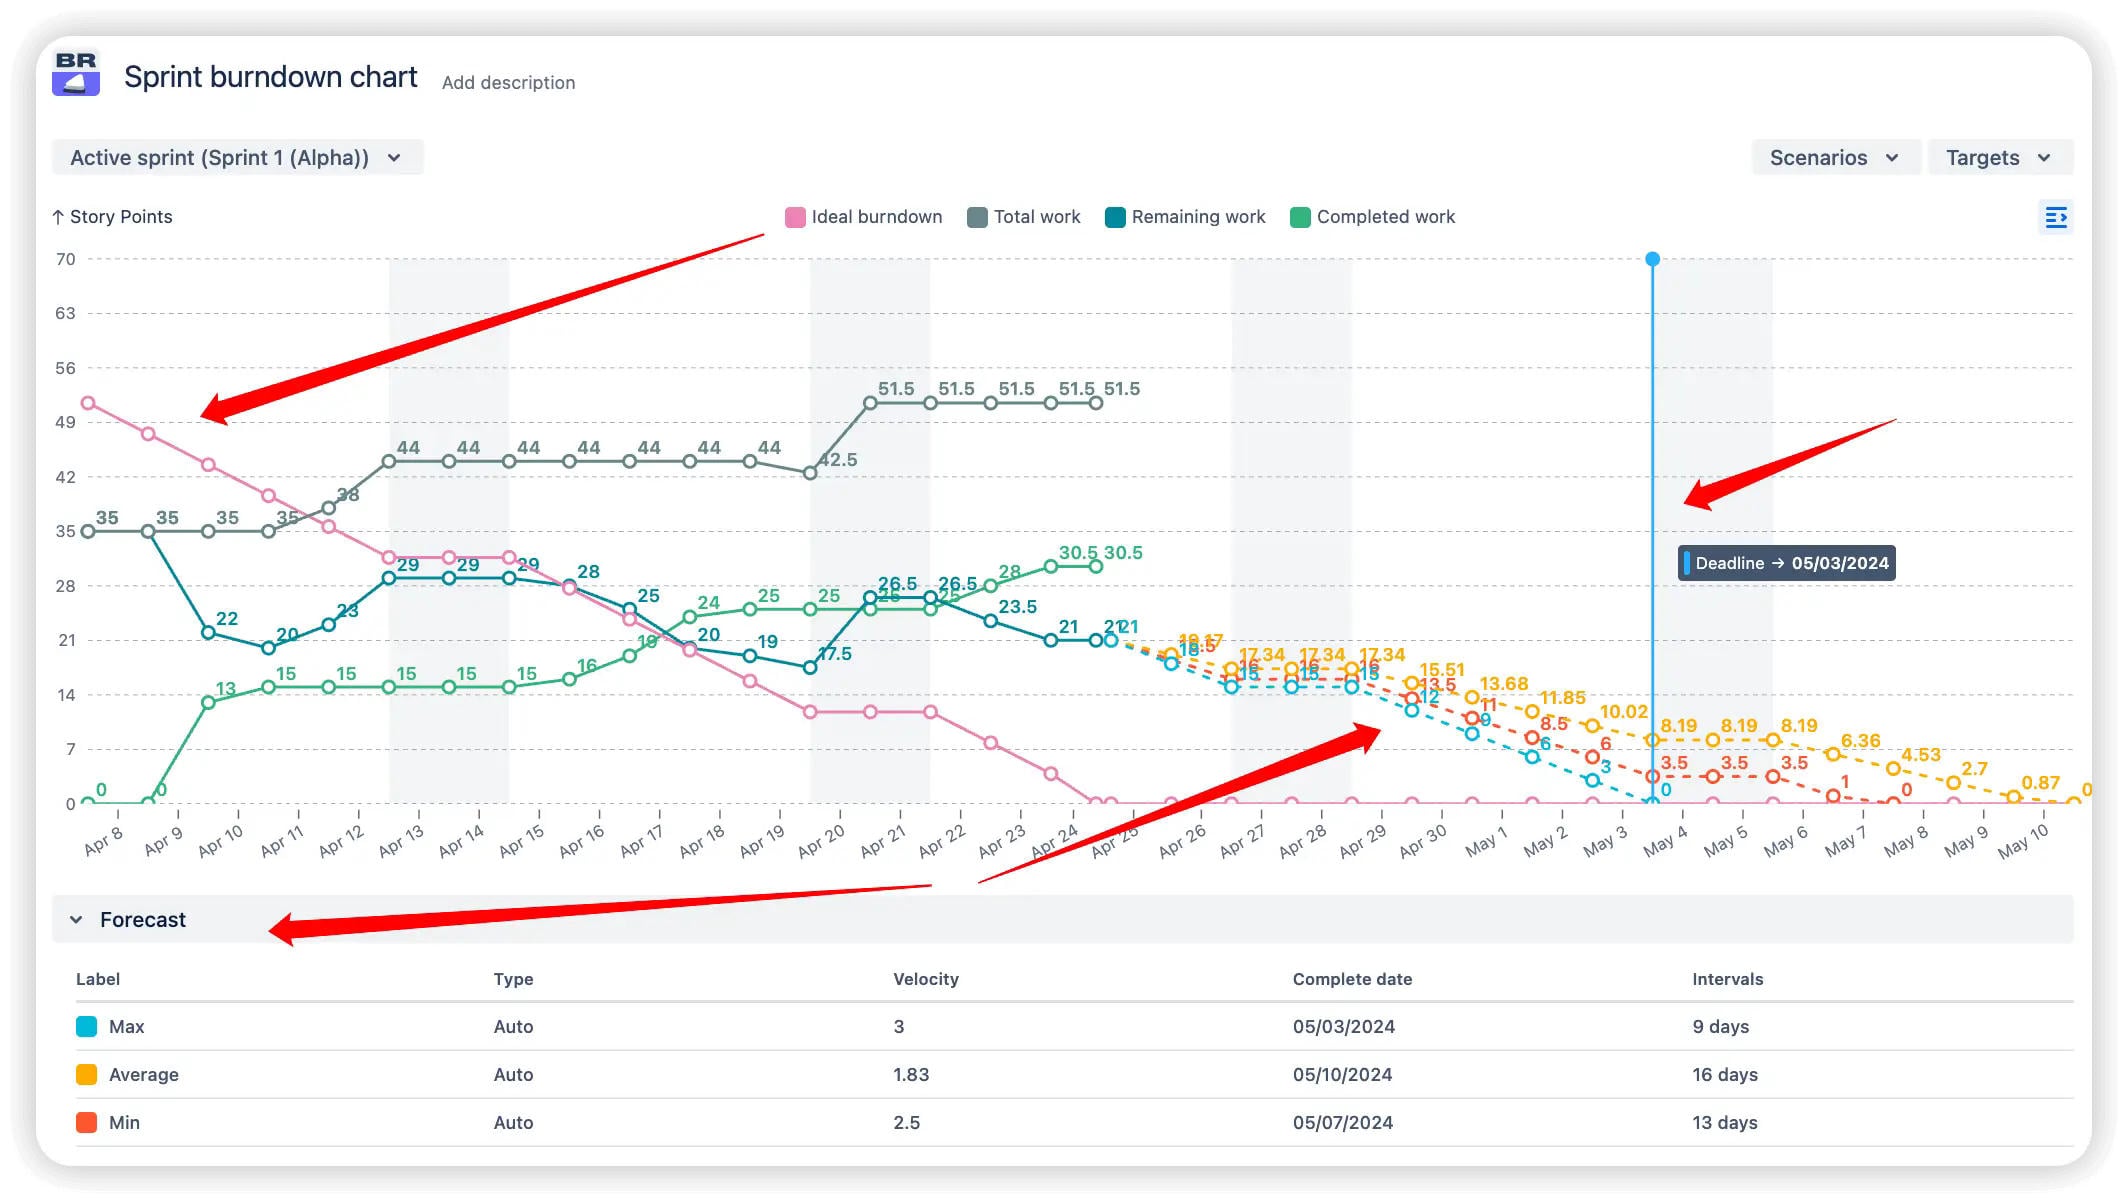
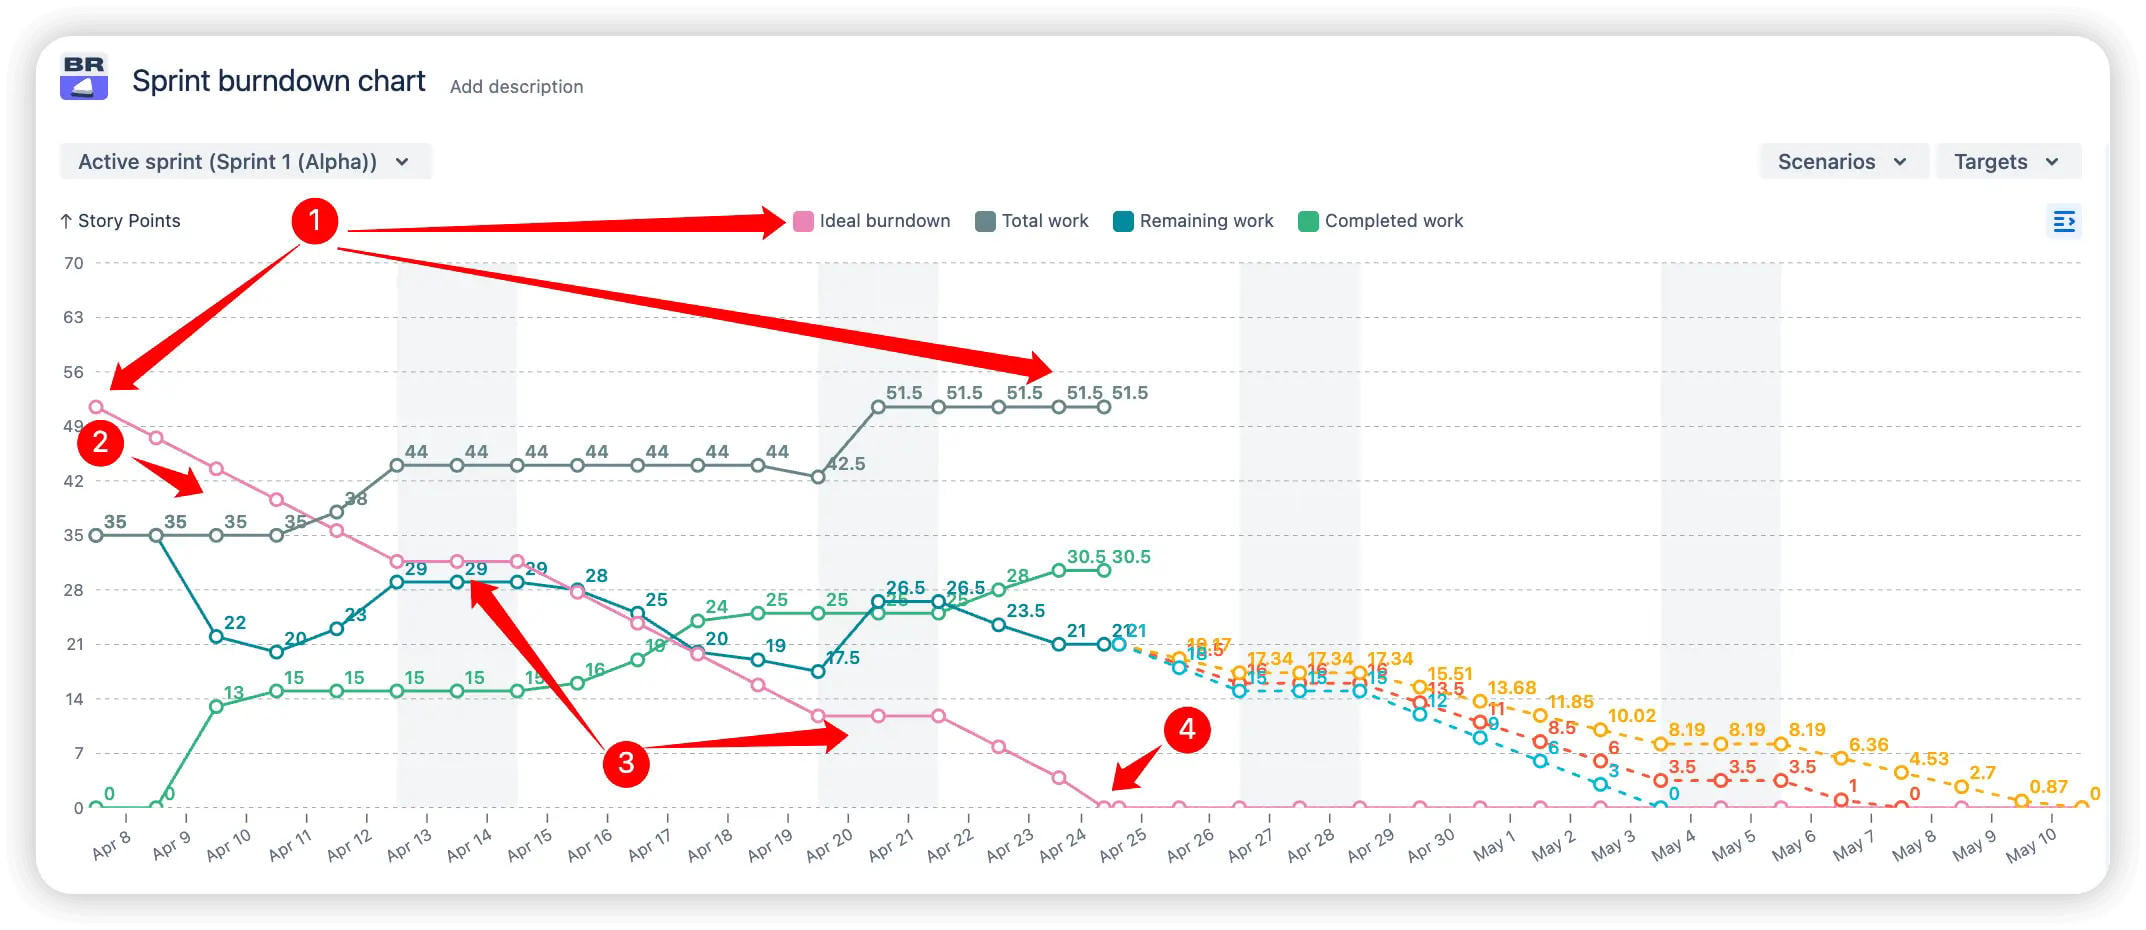
The Jira Sprint burndown chart is designed to help Scrum teams quickly assess whether they're on track to complete all remaining work by the end of the sprint. It automatically generates velocity-based forecasts, visualizes custom target deadlines, and provides an ideal burndown line as a benchmark for expected progress.
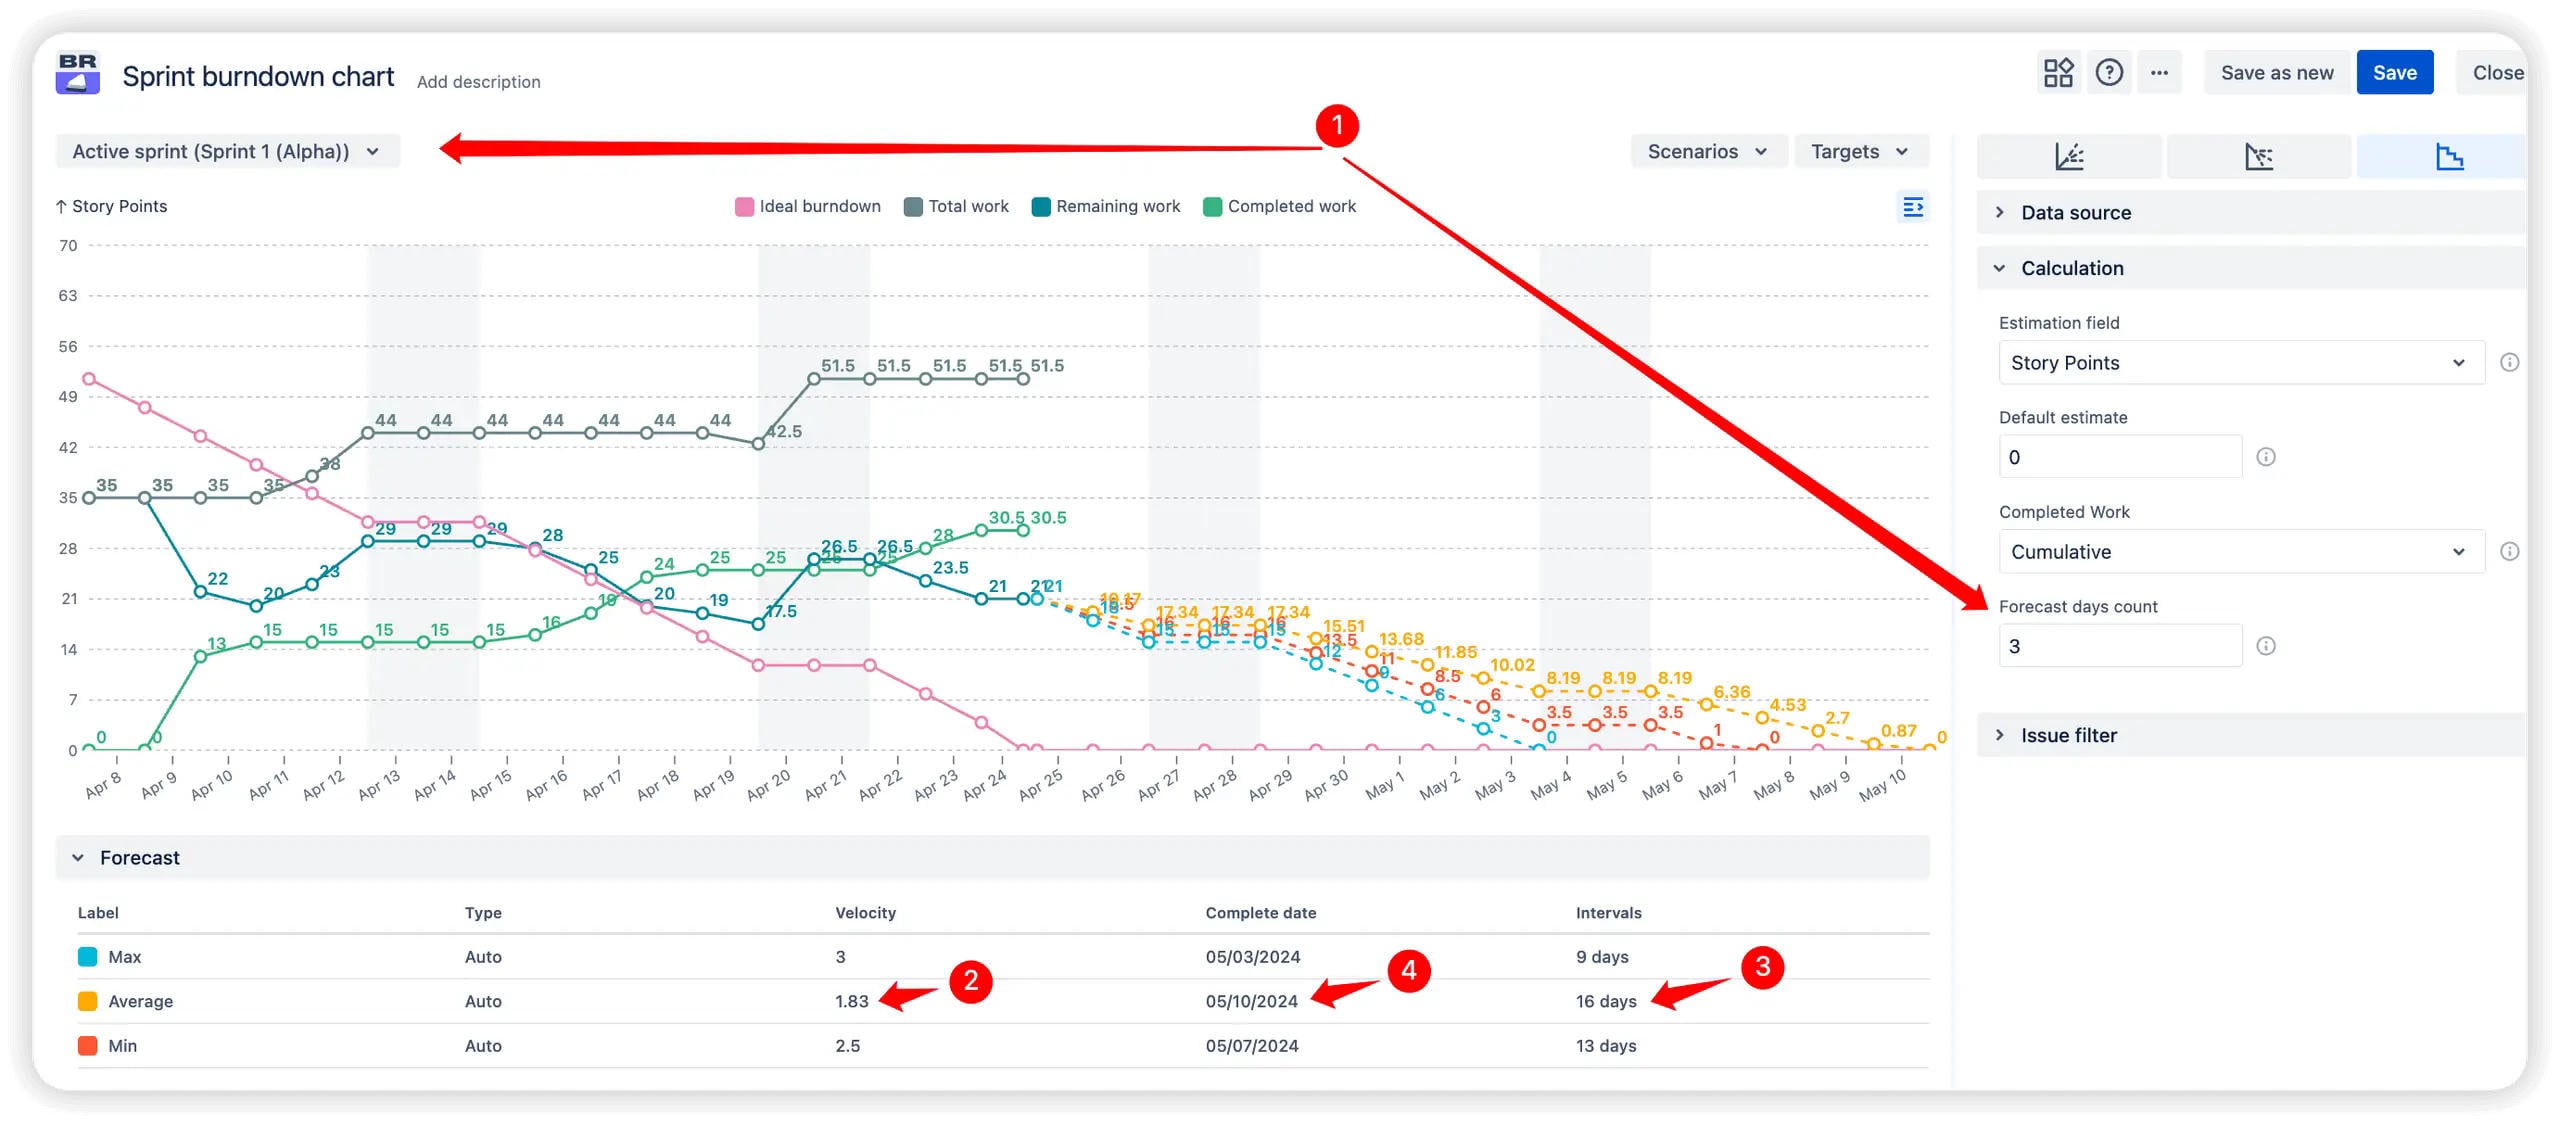
💫 1. Automatic velocity-based forecasts
The chart analyzes recent team velocity trends to auto-generate best-case, average, and worst-case projections for sprint completion. This enables quick and accurate forecasts without manual calculations.
✅ Benefit: Teams can detect delivery risks early and adjust plans accordingly, avoiding last-minute surprises.
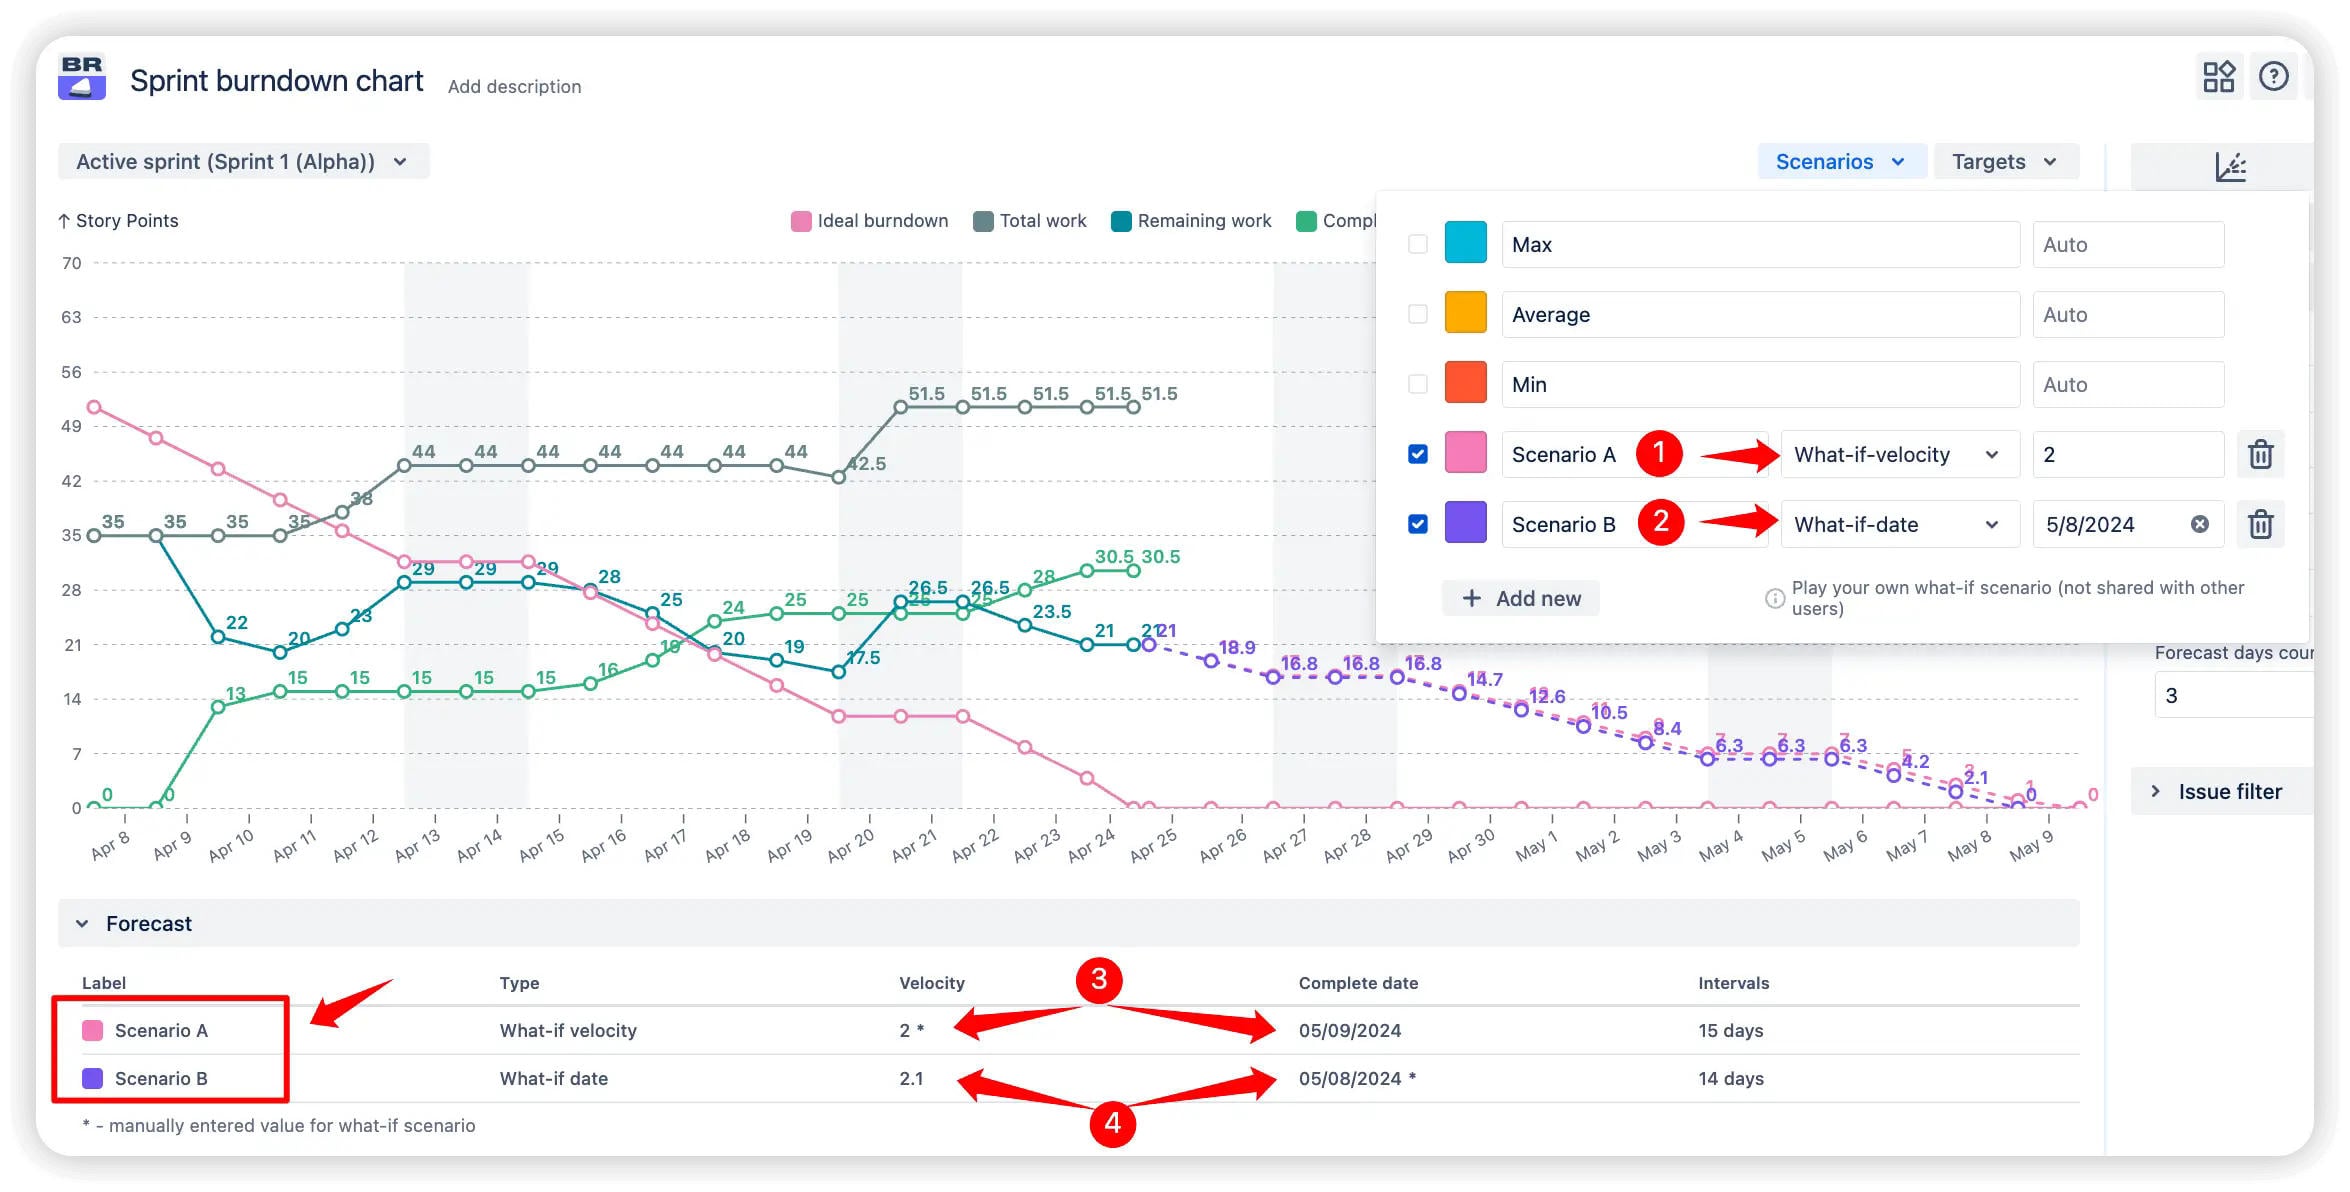
🔮 2. Custom remaining work forecast scenarios
This feature allows Scrum teams to model different sprint remaining work forecast scenarios by simulating changes in velocity or setting target delivery dates.
✅ Benefit: Teams can quickly understand how their projected progress shifts based on "what-if" assumptions.
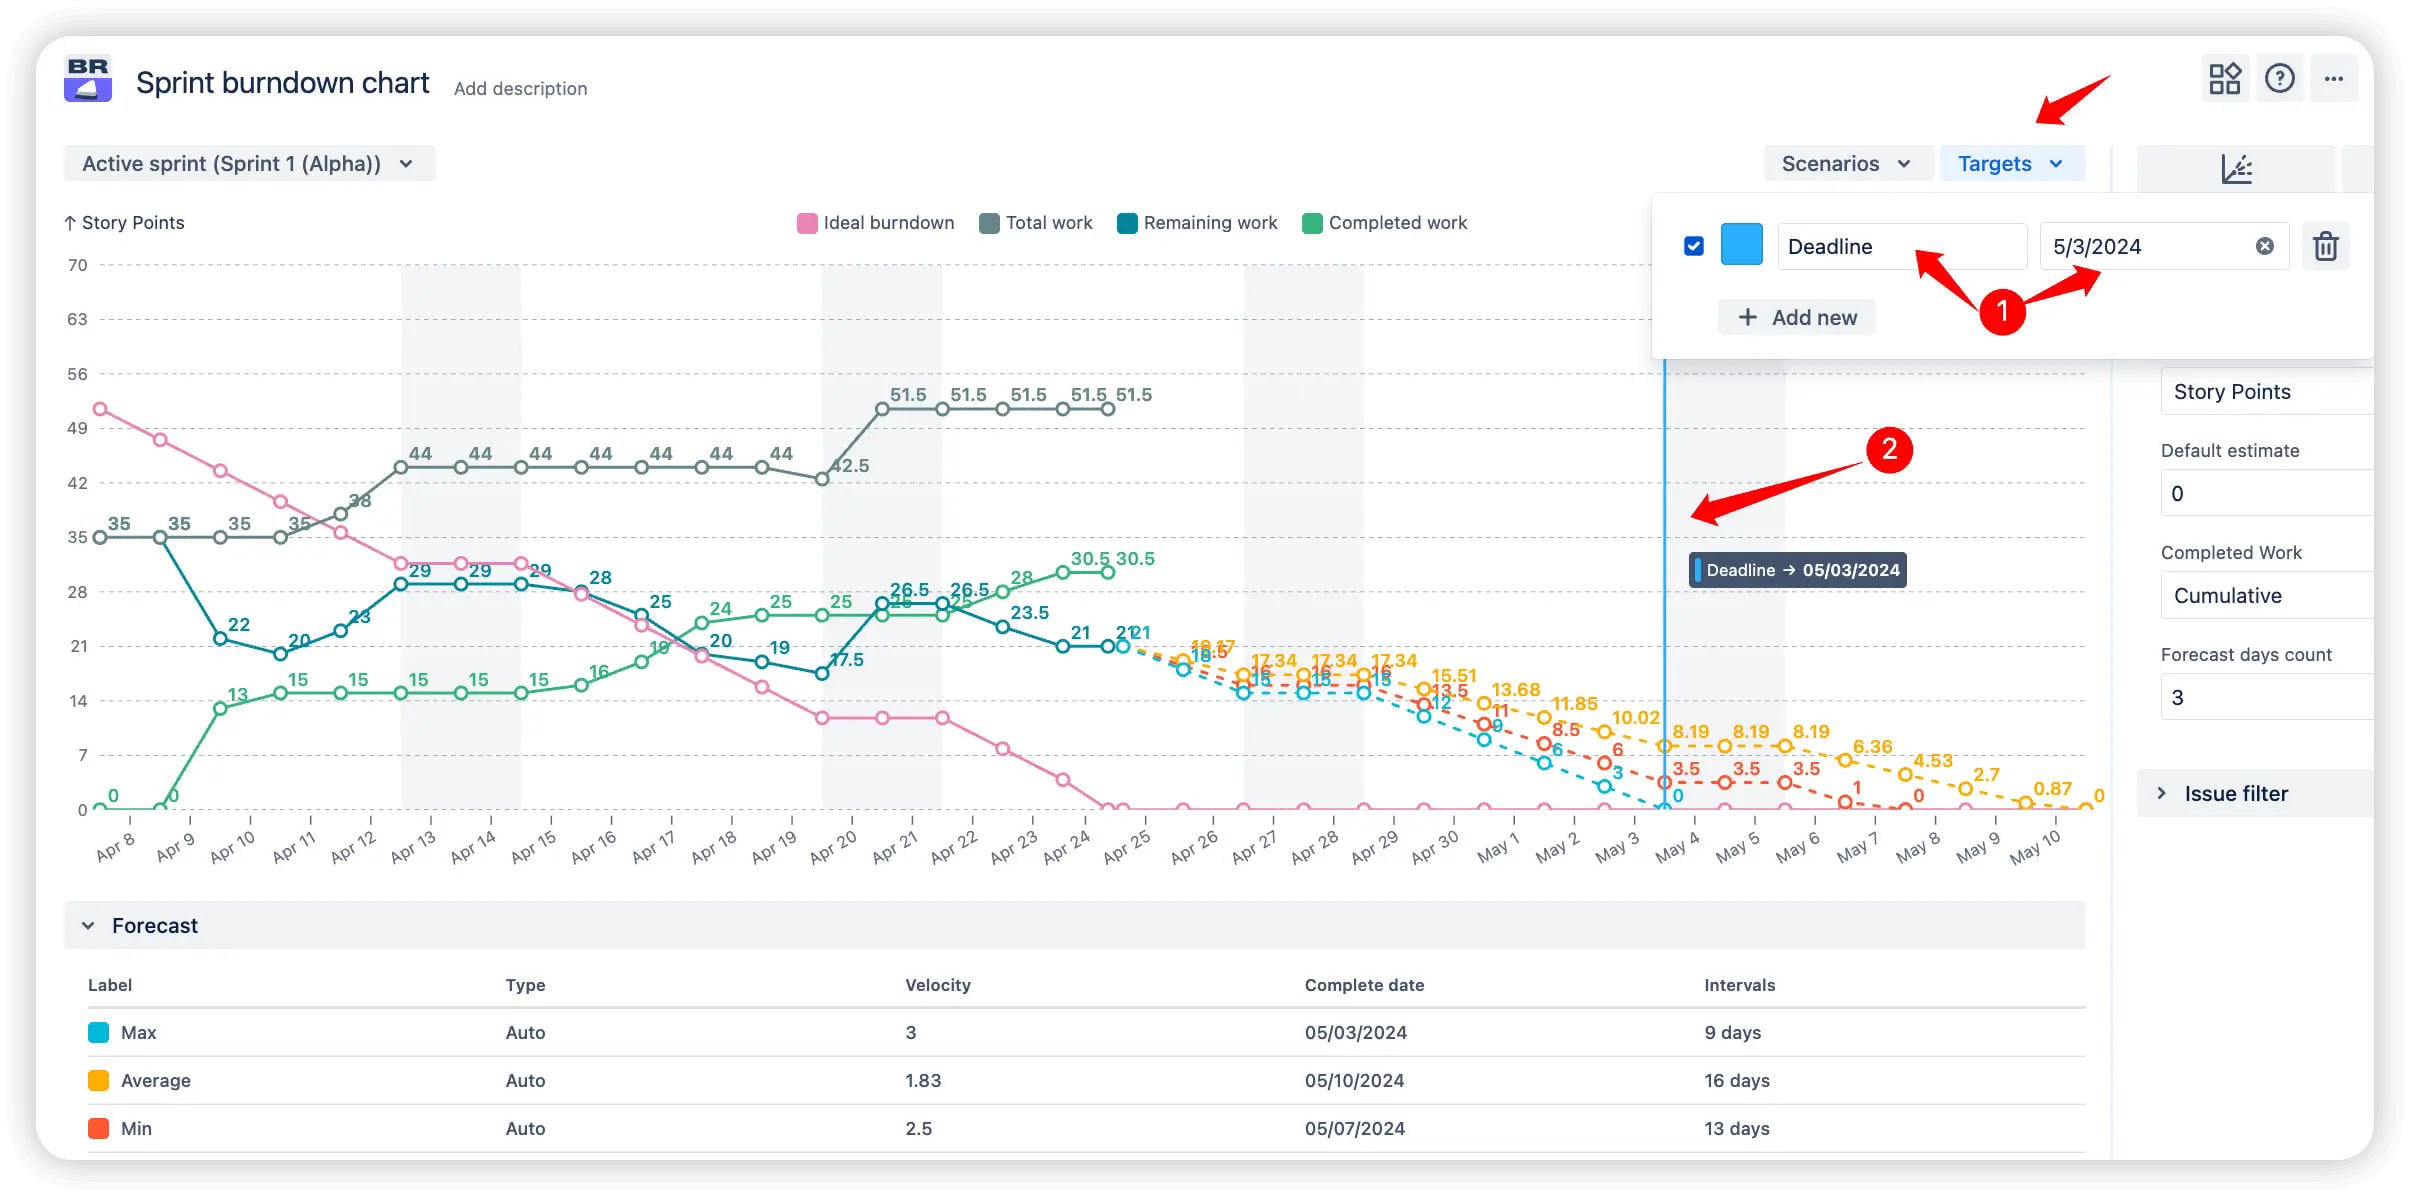
📆 3. Custom target deadlines
Scrum teams can add one or more target lines to the chart, representing key delivery milestones or stakeholder commitments. This allows them to visually track progress against specific goals and shift focus if needed.
✅ Benefit: Product managers and stakeholders gain confidence that top priorities will be delivered on time.
📉 4. Ideal burndown line
The chart displays an ideal burndown trajectory starting from the peak sprint scope and dropping evenly, excluding weekends. This provides a clear benchmark for teams to compare actual progress against the expected pace.
✅ Benefit: Scrum masters and tech leads can quickly spot delivery risks and support the team in staying on track.
Additional features: Advanced filtering & breakdowns
🔍 Advanced filtering: Customize the chart's scope with filters by parent tasks, sub-tasks, epics, releases, or custom JQL queries. This ensures you're tracking the right work.
💡 Detailed issue breakdowns: The interval selector within the active sprint, regardless of whether it’s past or upcoming, reveals the specific issues included in that projection, empowering you to quickly dive into the details.
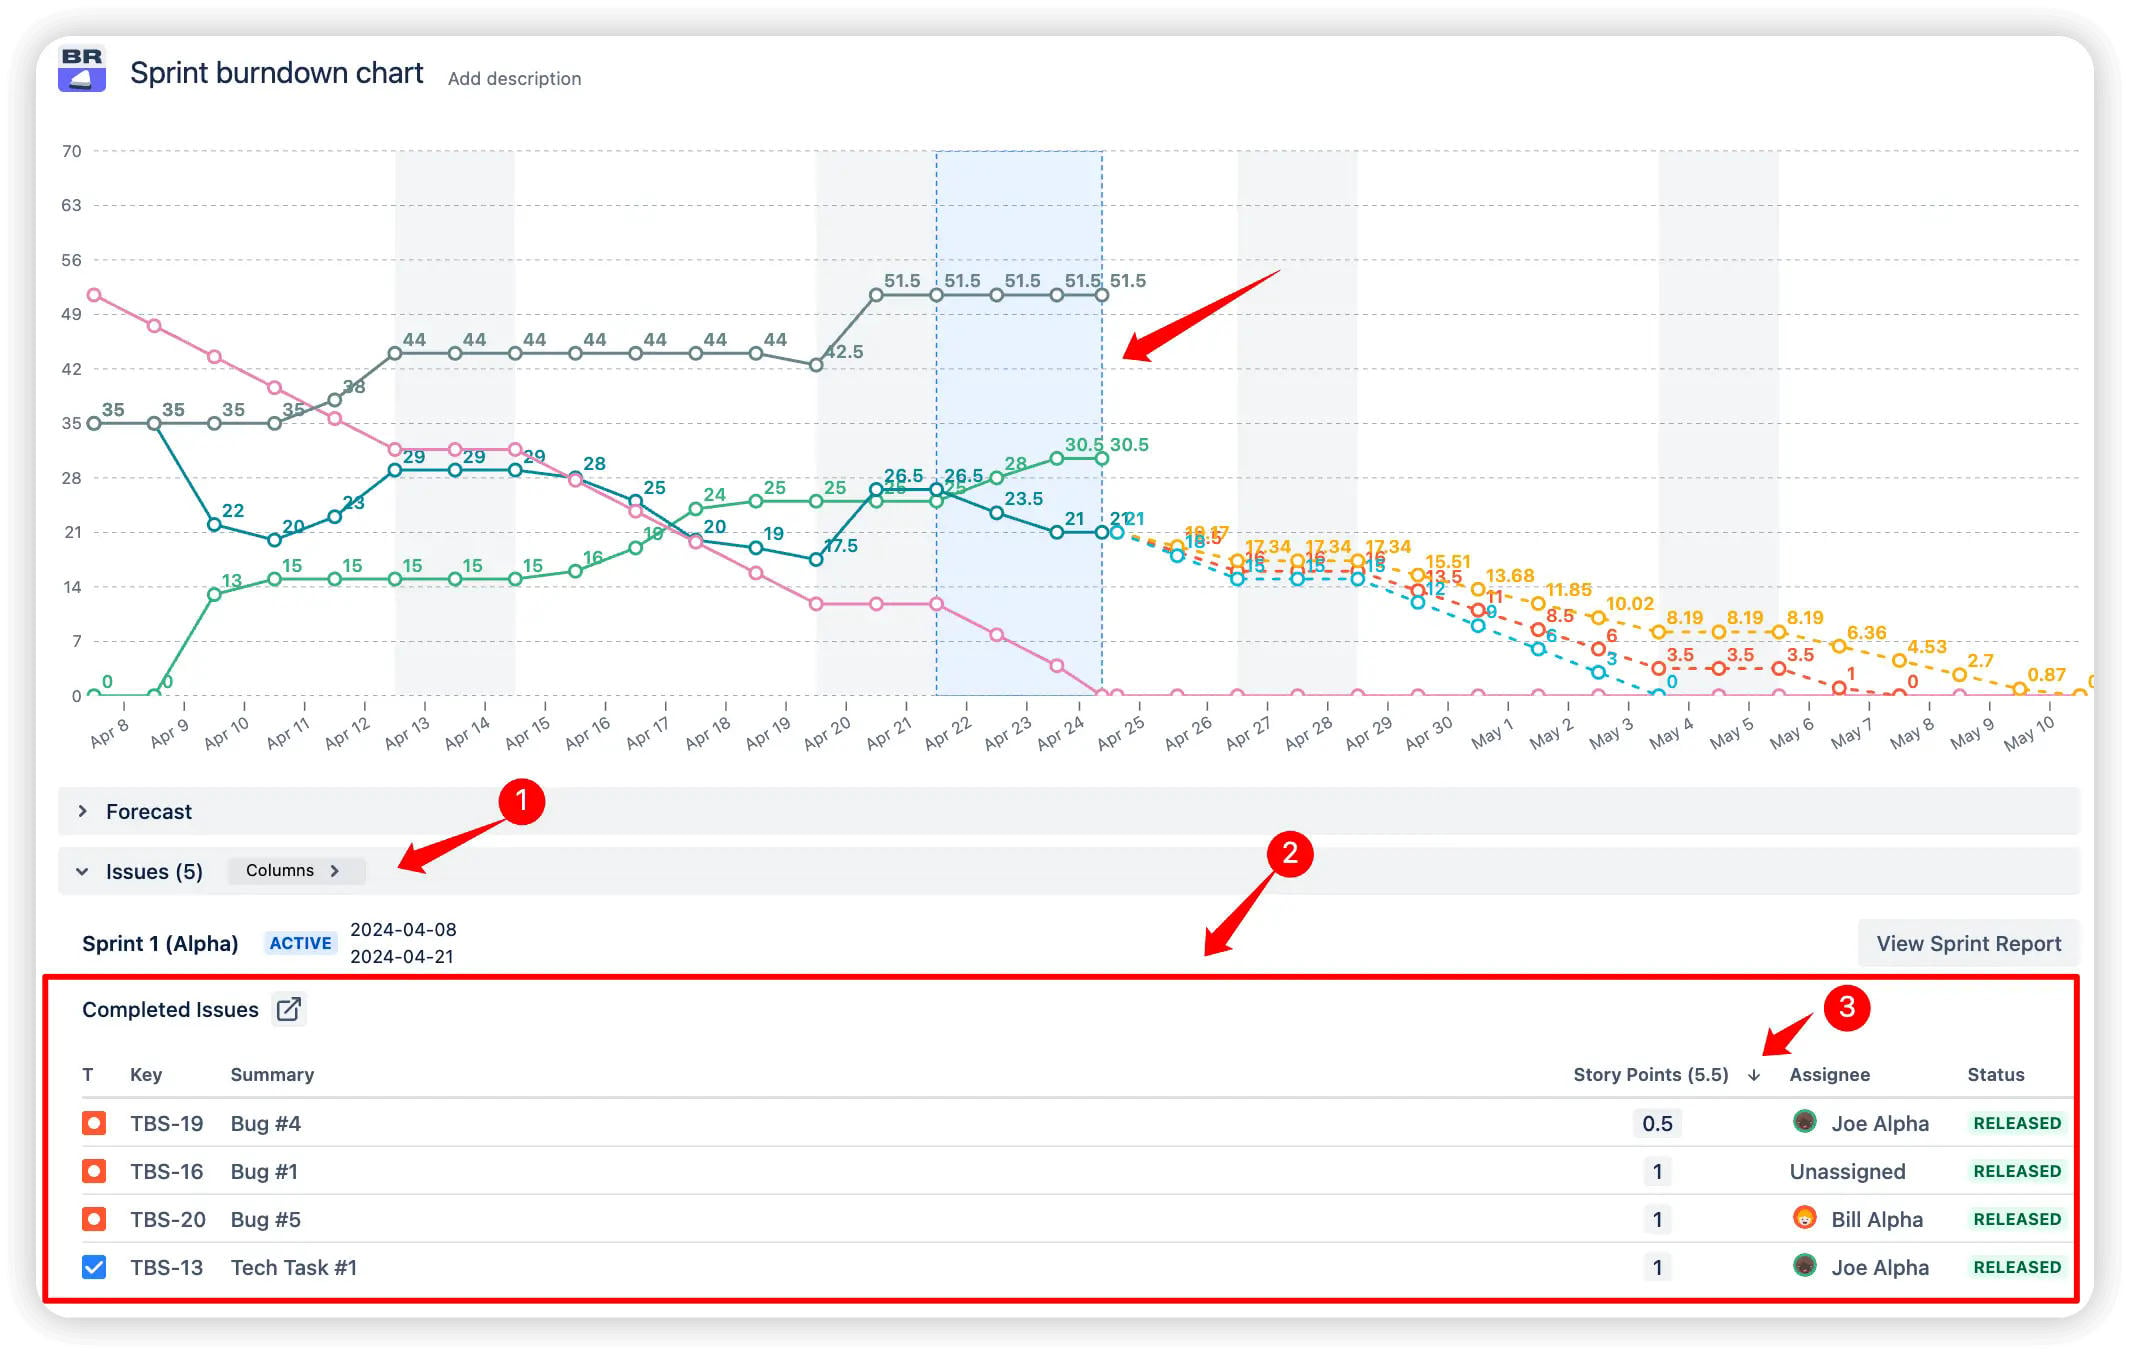
These features give Scrum teams the real-time visibility and forecasting capabilities they need to act faster, plan better, and improve sprint outcomes. By combining automatic projections, custom deadlines, and an ideal burndown benchmark, the Sprint burndown chart empowers everyone, from product managers to developers, to make data-driven decisions throughout the sprint.
Dive into Jira Sprint burndown chart with an Interactive example
Curious to see how Jira Sprint burndown chart works in action? We've got an interactive example ready for you to explore 👉 Jira Sprint burndown chart interactive example.
This interactive chart demo allows you to:
-
Explore an interactive and clickable chart that visualizes real-time sprint progress
-
Easily adjust the chart settings to see how different configurations impact the forecasts
-
Freely experiment with various scenarios to understand how the burndown chart can work in your specific use cases
By interacting with the chart, you'll get a hands-on feel for how the Sprint burndown report can give your Scrum team unparalleled visibility into sprint progress and forecasting.
Who it's for & how it helps
The Jira Sprint burndown chart benefits different Agile roles in the following ways:
👨💼 Product Manager:
🧑🏫 Scrum Master:
👨💻 Tech Lead:
Whether you're a Product Manager aligning with stakeholders, a Scrum Master supporting the team, or a Tech Lead balancing priorities, the Sprint Burndown Chart in your Jira dashboard gives you the real-time visibility and data-driven insights you need to deliver successfully.
How to set up Jira Sprint burndown chart on your Dashboard
The Jira Sprint burndown chart is part of the Agile Burnup Burndown Charts app, available as a separate gadget or inside the Agile Reports & Gadgets bundle.
Setting up the Sprint burndown chart on your Jira dashboard is quick and easy, allowing your Scrum team to start tracking valuable insights right away. Follow these simple steps to get the chart up and running:
-
📋 Go to your Jira dashboard and click "Add gadget"
-
🔍 Search for "Agile Burnup Burndown Charts"
-
🖱️ Click "Add" and configure filters, settings, and display options as needed
Don't waste time guessing. Set up the Sprint burndown chart on your Jira dashboard today and start leveraging the power of real-time insights to drive your Scrum team's success.
Wrap-up
The Jira Sprint burndown chart is a must-have tool for Scrum teams looking to forecast deliveries, adapt to change, and keep stakeholders aligned throughout the sprint. By adding this powerful gadget to your Jira dashboard, you can:
✨ Gain real-time visibility into sprint progress and remaining work
🚀 Detect delivery risks early and make data-driven adjustments
💪 Communicate sprint health clearly and confidently to stakeholders
🔗 Already want to try it in action? Check out our interactive example of Jira Sprint burndown chart to explore how it works in real-time.
Unlock the full potential of your Jira dashboard and take your Scrum execution to new heights!
💬 Contact Broken Build support for setup help, best-practice guidance, or advanced use cases
Support options:
Happy reporting,
The Broken Build Team
