If you’ve ever tried to measure how long an issue stays in a status or moves from one step to another using JQL, you’ve probably discovered how limited Jira Query Language really is.
Sure, JQL is great for filtering issues by status, assignee, and date. But when it comes to cycle time, resolution time, or status duration… things get tricky.

Let’s walk through some of the most common JQL queries people use to approximate time tracking — and show you how the Time Metrics Tracker | Time Between Statuses app gives you the real answer.
✅ What Are You Trying to Do?
Many Jira users want to answer questions like:
- How long was the work item “In Progress”?
- What’s our average Cycle Time or Lead Time?
- How long do approvals or reviews take?
- Can I get this with JQL (Jira Query Language)?
Let’s clarify.
❓ Can I Calculate Time Metrics in Jira Using JQL?
JQL is useful for filtering work items, but not for calculating durations between status changes. It can tell you if something happened, but not how long it took.
You can search:
status changed to "Done" after -7d
But you can’t ask:
🕒 “How long was this issue in development?”
🧪 Most Common JQL Time Queries in Jira
Let’s break it down:
|
🔍 Goal
|
🧾 JQL
|
⚠️ What It Misses
|
✅ What TMT Gives You
|
|
⏱️ Cycle Time
|
status changed to "Done" after -14d
|
When it finished, but not how long it took
|
Use To Do → Done report
|
|
🕓 Lead Time
|
created >= -30d AND status = Done
|
Filters by created/resolved, no timing
|
Use Created → Done metric
|
|
✅ Resolution Time
|
resolved >= -7d AND resolution IS NOT EMPTY
|
Shows resolved issues, no duration
|
Use In Progress → Resolved
|
|
🛠️ Time in Status
|
status = "QA Review" AND updated >= -10d
|
Shows current status, not time spent
|
See Time Spent in Status report
|
|
🔄 Transition Time
|
status changed FROM "Dev" TO "QA"
|
When it moved—not how long it took
|
Use Dev → QA custom metric
|
|
⏳ Wait Time
|
status = "Waiting for Customer"
|
Can’t show how long it waited
|
Track the exact time in that status
|
|
🙋 Time to First Response
|
status changed FROM "Open" TO "In Progress"
|
No time calculation included
|
Use Open → In Progress metric
|
|
📊 Avg. Transition Time
|
Not possible
|
JQL doesn’t do averages
|
TMT’s Average Time Report does
|
|
🎯 Custom Filtering
|
project = BANKING AND issuetype = "Loan Request"
|
Only filters issues
|
Combine with time reports in TMT
|
|
🛑 Issues Taking Too Long
|
status = "In Progress" AND NOT status changed AFTER -10d
|
Shows stuck tasks—but not how long
|
TMT shows exact time in In Progress
|
Instead of hacking together time analysis with JQL, use a purpose-built tool that delivers:
- ⏳ Cycle Time
- 🧩 Custom Transition Times (e.g. QA → Approval)
- 🕐 Time in Each Status
- 🛑 Wait Time and Blocked Time
- 💡 Resolution and Lead Time
- 📈 Average Time Report
- 📊 WIP Run Chart Gadget
- 🔍 Scatter Plot Gadget
- 📤 Export to Excel/CSV
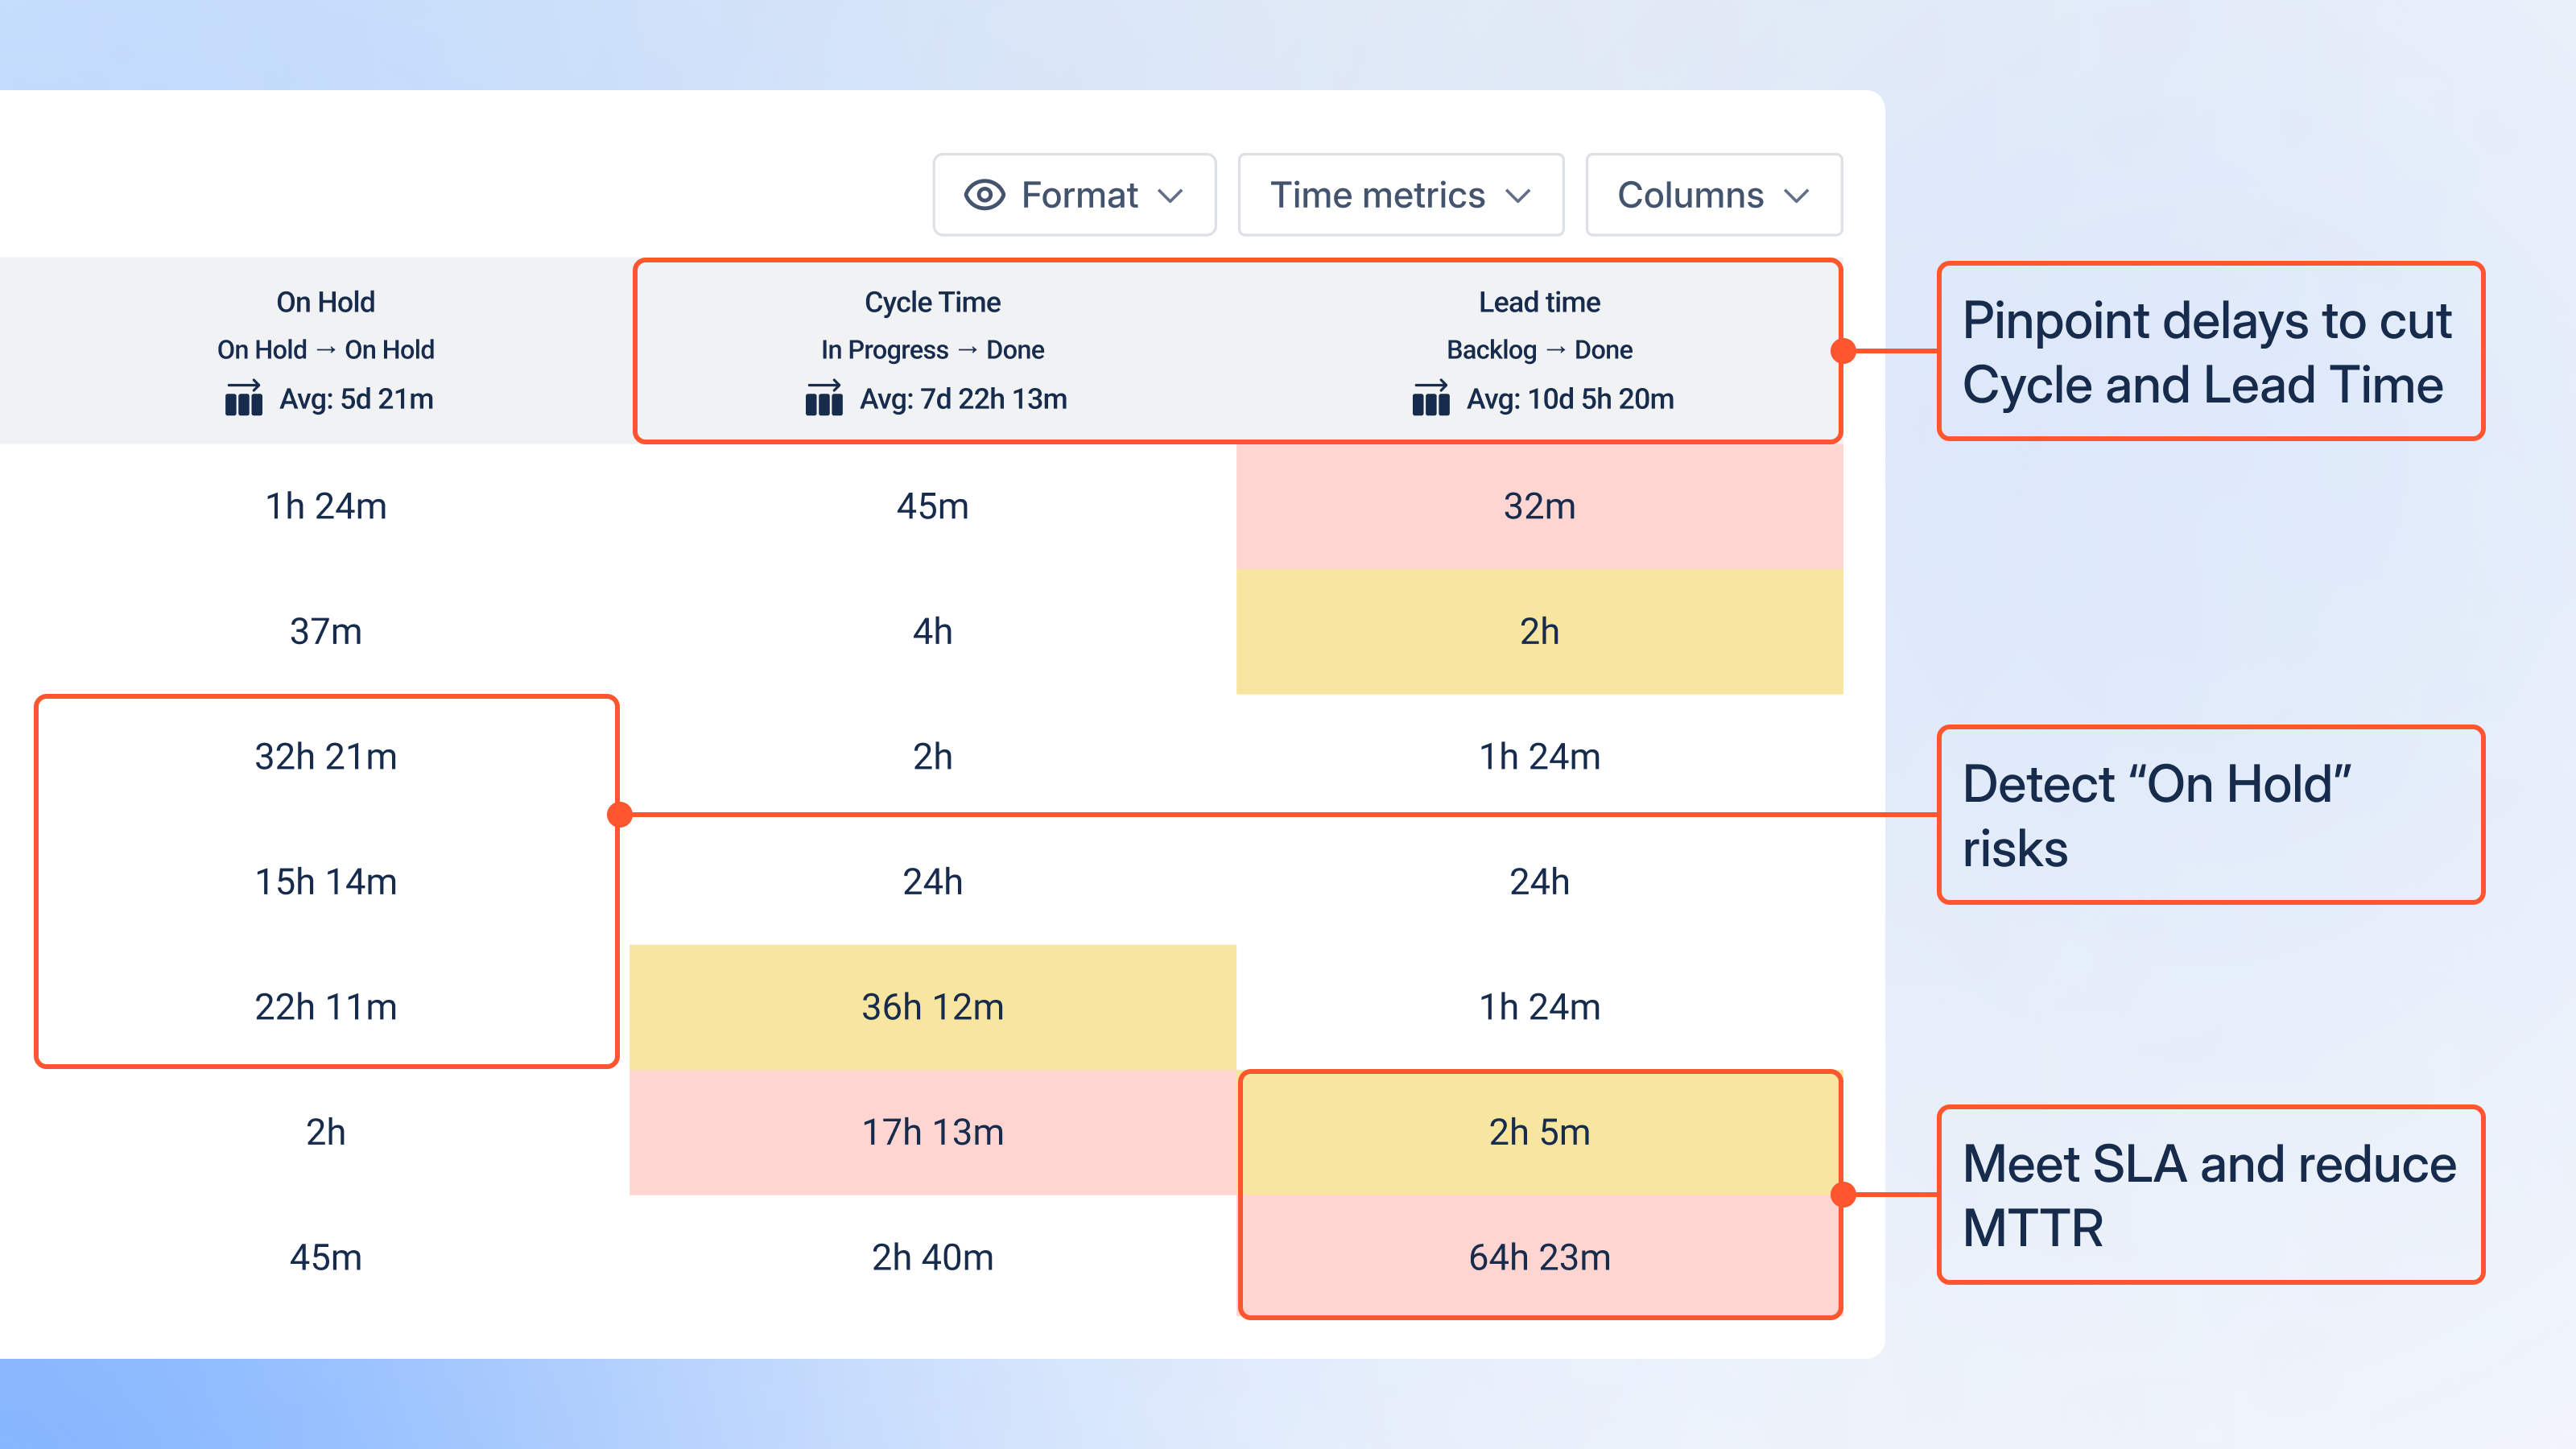
And yes — you can combine it with your JQL filters to target specific projects, issue types, or teams.
🎯 Example Use Case: Cycle Time for Loan Requests
Want to know how long your “Loan Request” issues take to go from “Submitted” to “Approved”?
JQL-only approach:
project = BANKING AND issuetype = "Loan Request"
(You can filter the issues, but NOT calculate how long that transition took.)
With Time Metrics Tracker:
Apply the same JQL to filter your data, then define a custom time metric from
➡️ Submitted → Approved and get full cycle time analytics.
📤 Export Your Results
With one click, export your results to:
- Excel / CSV
- Pivot tables
- Charts (Pie/Bar via spreadsheet)
Perfect for stakeholder reporting, audits, and team retros.
⚙️ Built for Jira, Built for Security
- ✅ Built on Atlassian Forge
- ✅ Works with any custom workflow
- ✅ No external data transfer
- ✅ Fits Jira Dashboards with real-time gadgets
🚀 Summary
If you’ve ever Googled:
- “Jira JQL cycle time”
- “Time in status JQL”
- “Jira duration between statuses”
…then it’s time to level up.
JQL helps you filter, but Time Metrics Tracker | Time Between Statuses helps you truly measure and optimize your workflow.
