If you’ve ever found yourself wondering why the same Jira work item keeps bouncing between “In Development” and “Testing,” you’re not alone. These back-and-forth loops can slow everything down, not just the sprint, but team morale, clarity, and even trust in the process.
Whether you're a Scrum Master, Agile Coach, Project Manager, or Jira Admin, being able to see what's going wrong — and why clearly — can make all the difference. But Jira doesn’t always surface that information easily.
Let’s discuss a more effective way to track and enhance your development–test cycles, without adding overhead or friction.
What Typically Gets in the Way
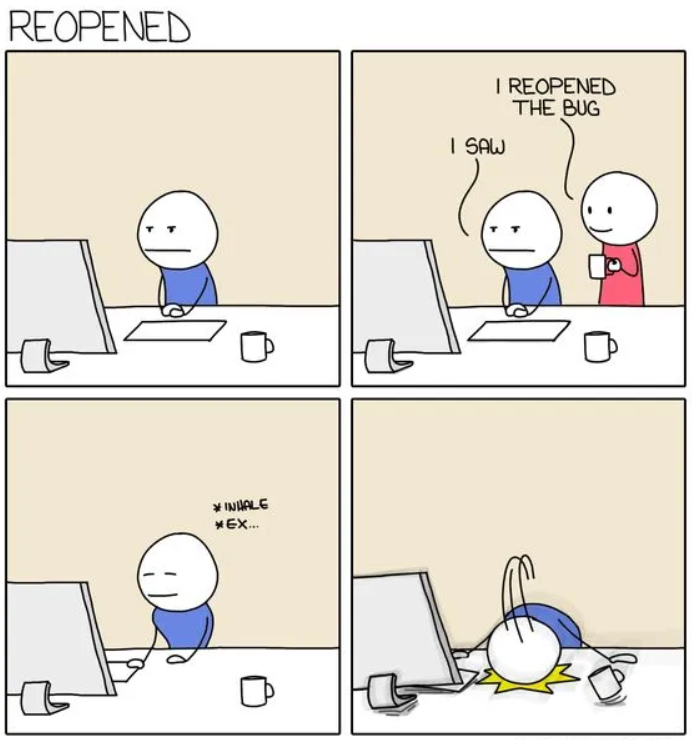
- Work keeps bouncing back and forth
It’s challenging to maintain momentum when tasks leave testing, return to development, and then go back to testing again.
- No easy way to spot patterns
You might feel like “we’ve seen this before,” but it’s hard to prove or explain.
- Manual workarounds take too much time
Creating subtasks or digging through Jira history to explain rework is tedious and rarely scalable.
🛠 A Smarter Way to See What’s Going On
You don’t need to change your workflow — just make it more visible. With tools like the Time in Status app, you can uncover the trends and blockers behind dev–test loops, using the data you already have. Here’s how it works:
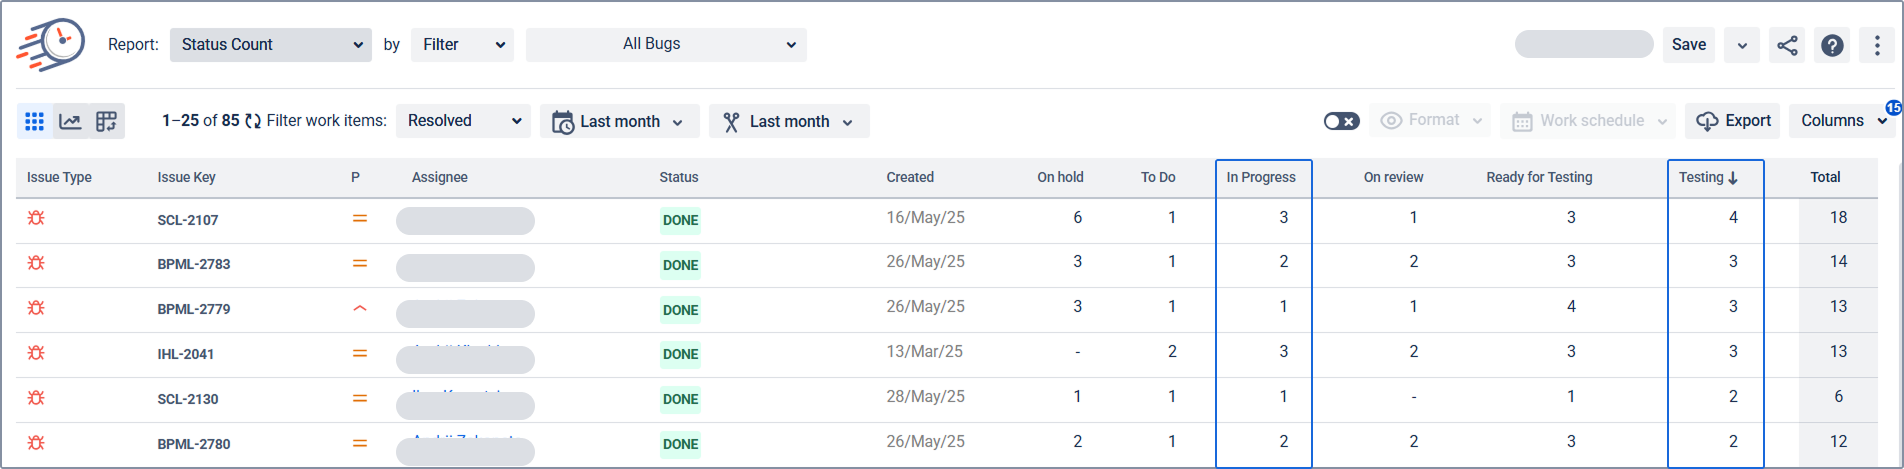
📊 Status Count Report – See how often work items were in different statuses
This shows how many times a task enters each status (like “Testing” or “In Progress”).
Why it helps: If a work item enters “Testing” four times, it’s a signal — maybe the definition of done isn’t clear, or bugs keep slipping through.
📊 Time in Status Report – See where time is actually being spent
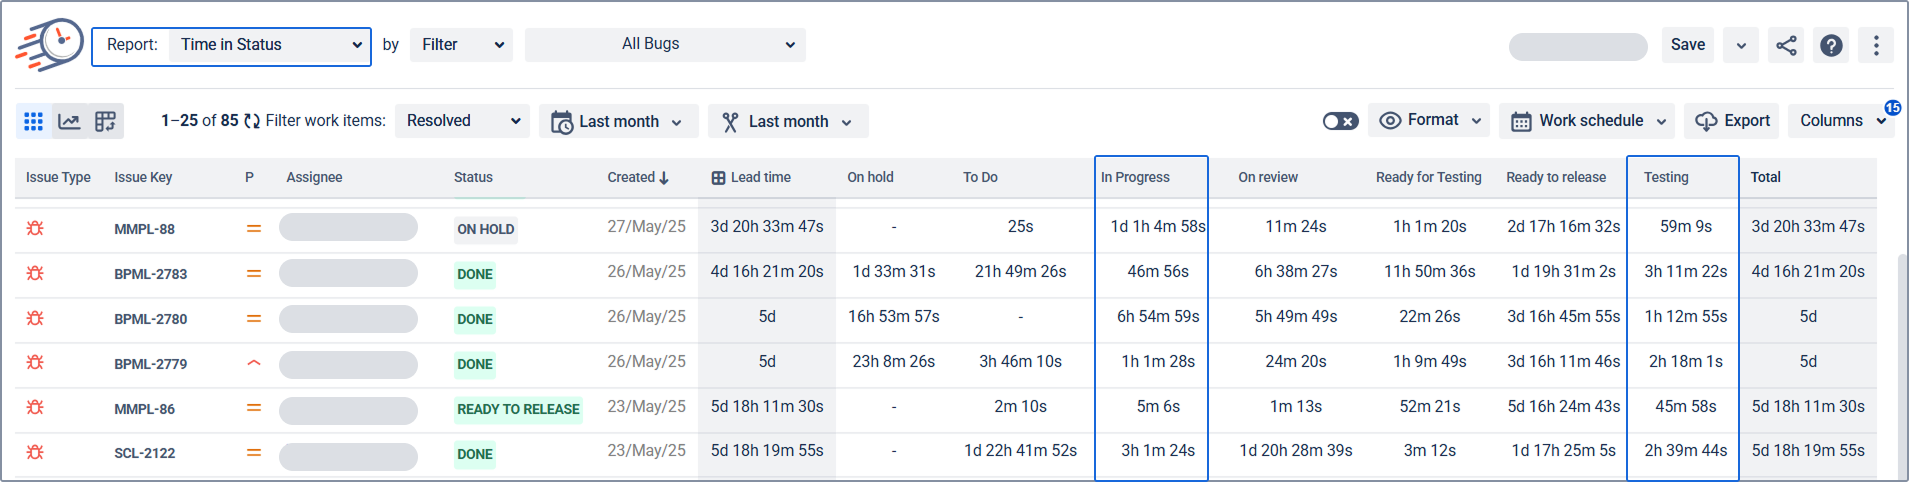
This report shows how long work items sit in each status.
Why it helps: If tasks stall in “Testing” for two days at a time, you may need to check if testers are overloaded or if the acceptance criteria require more clarity.
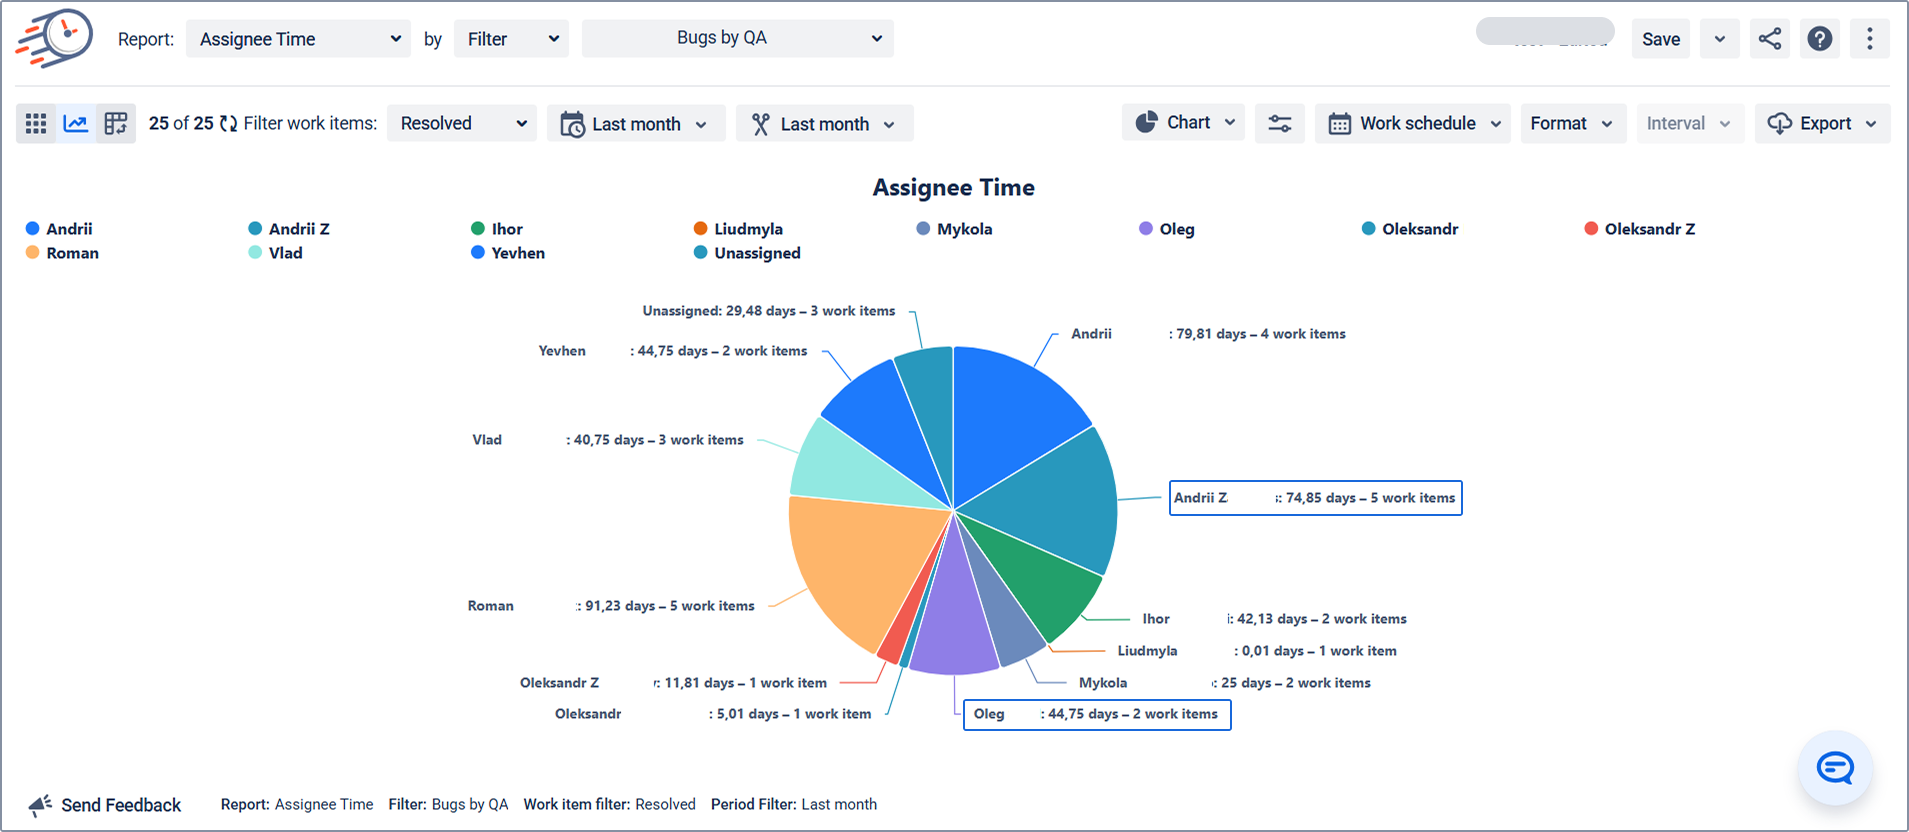
📊 Assignee Time Report – See how time is distributed across your team
This helps you understand how long tasks are assigned to specific individuals.
Why it helps: If one team member is consistently holding work longer than others, it may be a sign of a capacity issue or that someone needs support.
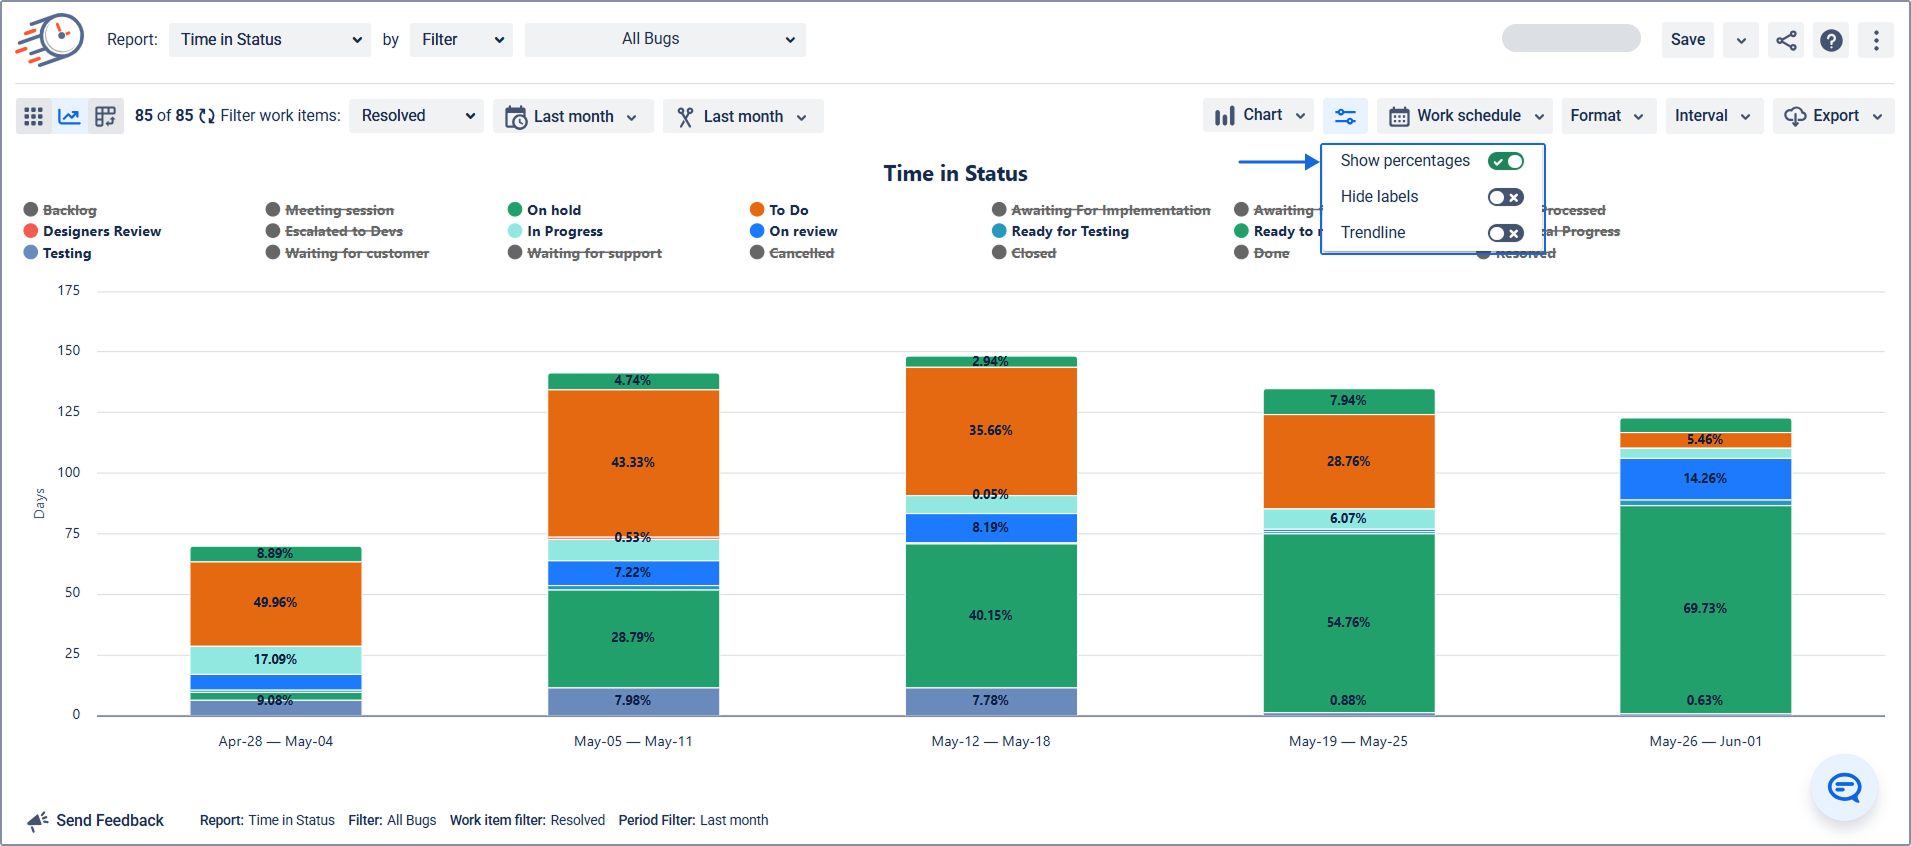
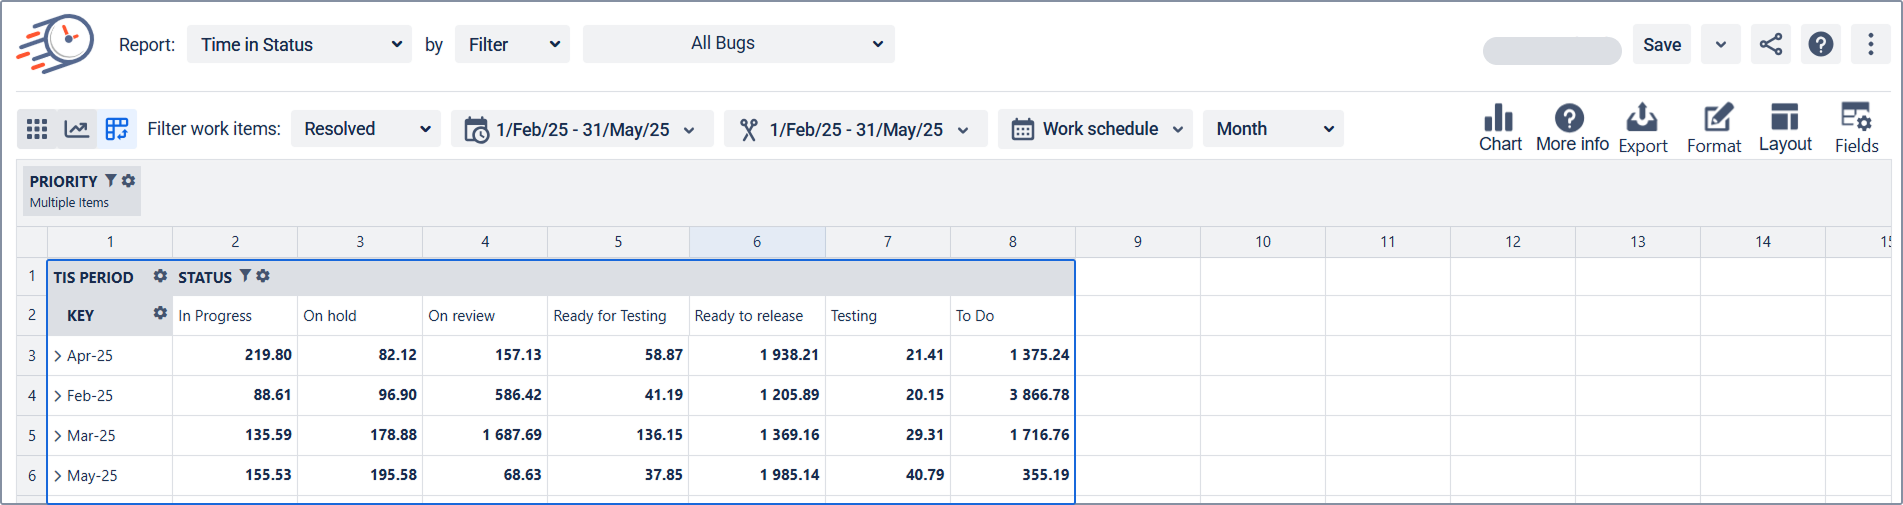
📊 Pivot Table View – Analyze historical patterns over time
Pivot tables allow you to compare time spent in statuses across multiple work items, sprints, or teams — all in one flexible view.
Why it helps: It’s perfect for spotting trends. For example, you can quickly see if the time spent in “Testing” has been gradually increasing over the last three sprints, or if one work item type consistently takes longer in review. This insight helps you make data-backed decisions during retrospectives or sprint planning, without needing to export data to spreadsheets.
📈 Tips to Get the Most Value from These Reports
- Use the Status Count Report in retrospectives to discuss where rework occurs most frequently. It can help uncover stories that loop between development and testing multiple times.
- Check the Time in Status Report weekly to spot delays or identify stages where work consistently gets stuck — whether it’s “Code Review,” “Blocked,” or “Testing.”
- Review the Assignee Time Report before sprint planning to help with load balancing and identify team members who may be overloaded or underutilized.
- Use the Pivot Table View to analyze patterns across multiple sprints, teams, or work item types. It’s especially useful for identifying how cycle time changes over time and for comparing workflow performance across projects, all without requiring the export of Jira data. Great for long-term process improvement and executive updates.
A Few Practical Use Cases
- Spot rework early
If work items regularly resurface during development, your reports can help identify them before they become a sprint-wrecker.
- Improve backlog grooming
Frequent dev–test loops might indicate unclear requirements or last-minute scope changes.
- Balance workloads
Use time-per-assignee data to ensure that no one is assigned the heaviest or most error-prone work.
No Big Changes — Just Better Insight
Improving development–test cycles doesn’t mean adding more Jira fields, changing your workflow, or asking your team to log more time. It simply means recognizing what’s already happening and using that information to work more efficiently.
Tools like Time in Status by SaaSJet help you get there. And if you’re curious, you can explore the app and even try it out with your current setup, no significant process changes needed. Try visualizing your current workflow with a couple of these reports — you might be surprised by what you find.
