Issues lagging in your sprints, but can’t pinpoint why? It’s a common challenge especially when Jira shows movement, but the actual progress isn’t there.
Teams often see issues “move” across statuses yet when the sprint ends, goals aren’t met. Without visibility into full issue history, it’s nearly impossible to uncover where delays actually occur.
That’s where Issue Delivery Report for Jira comes in.
In this article, you’ll learn how the app uses issue history and status-based phase analysis to detect bottlenecks, highlight delivery risks, and guide smarter Agile decisions with real-world examples.

The Problem: Work Looks Busy, But Outcomes Fall Short
Imagine this: your board is full, your team is active, but when the sprint ends, only 5 out of 12 issues are done.
Why?
Without a clear view of how time is spent in different stages, it’s difficult to:
-
Spot where issues wait unnecessarily
-
Understand blockers vs. flow
-
Track stories added too late to succeed
Total cycle time is just a number — without breakdown, it hides the root cause.
A Better Way: Analyze the Full Lifecycle with Issue Delivery Report
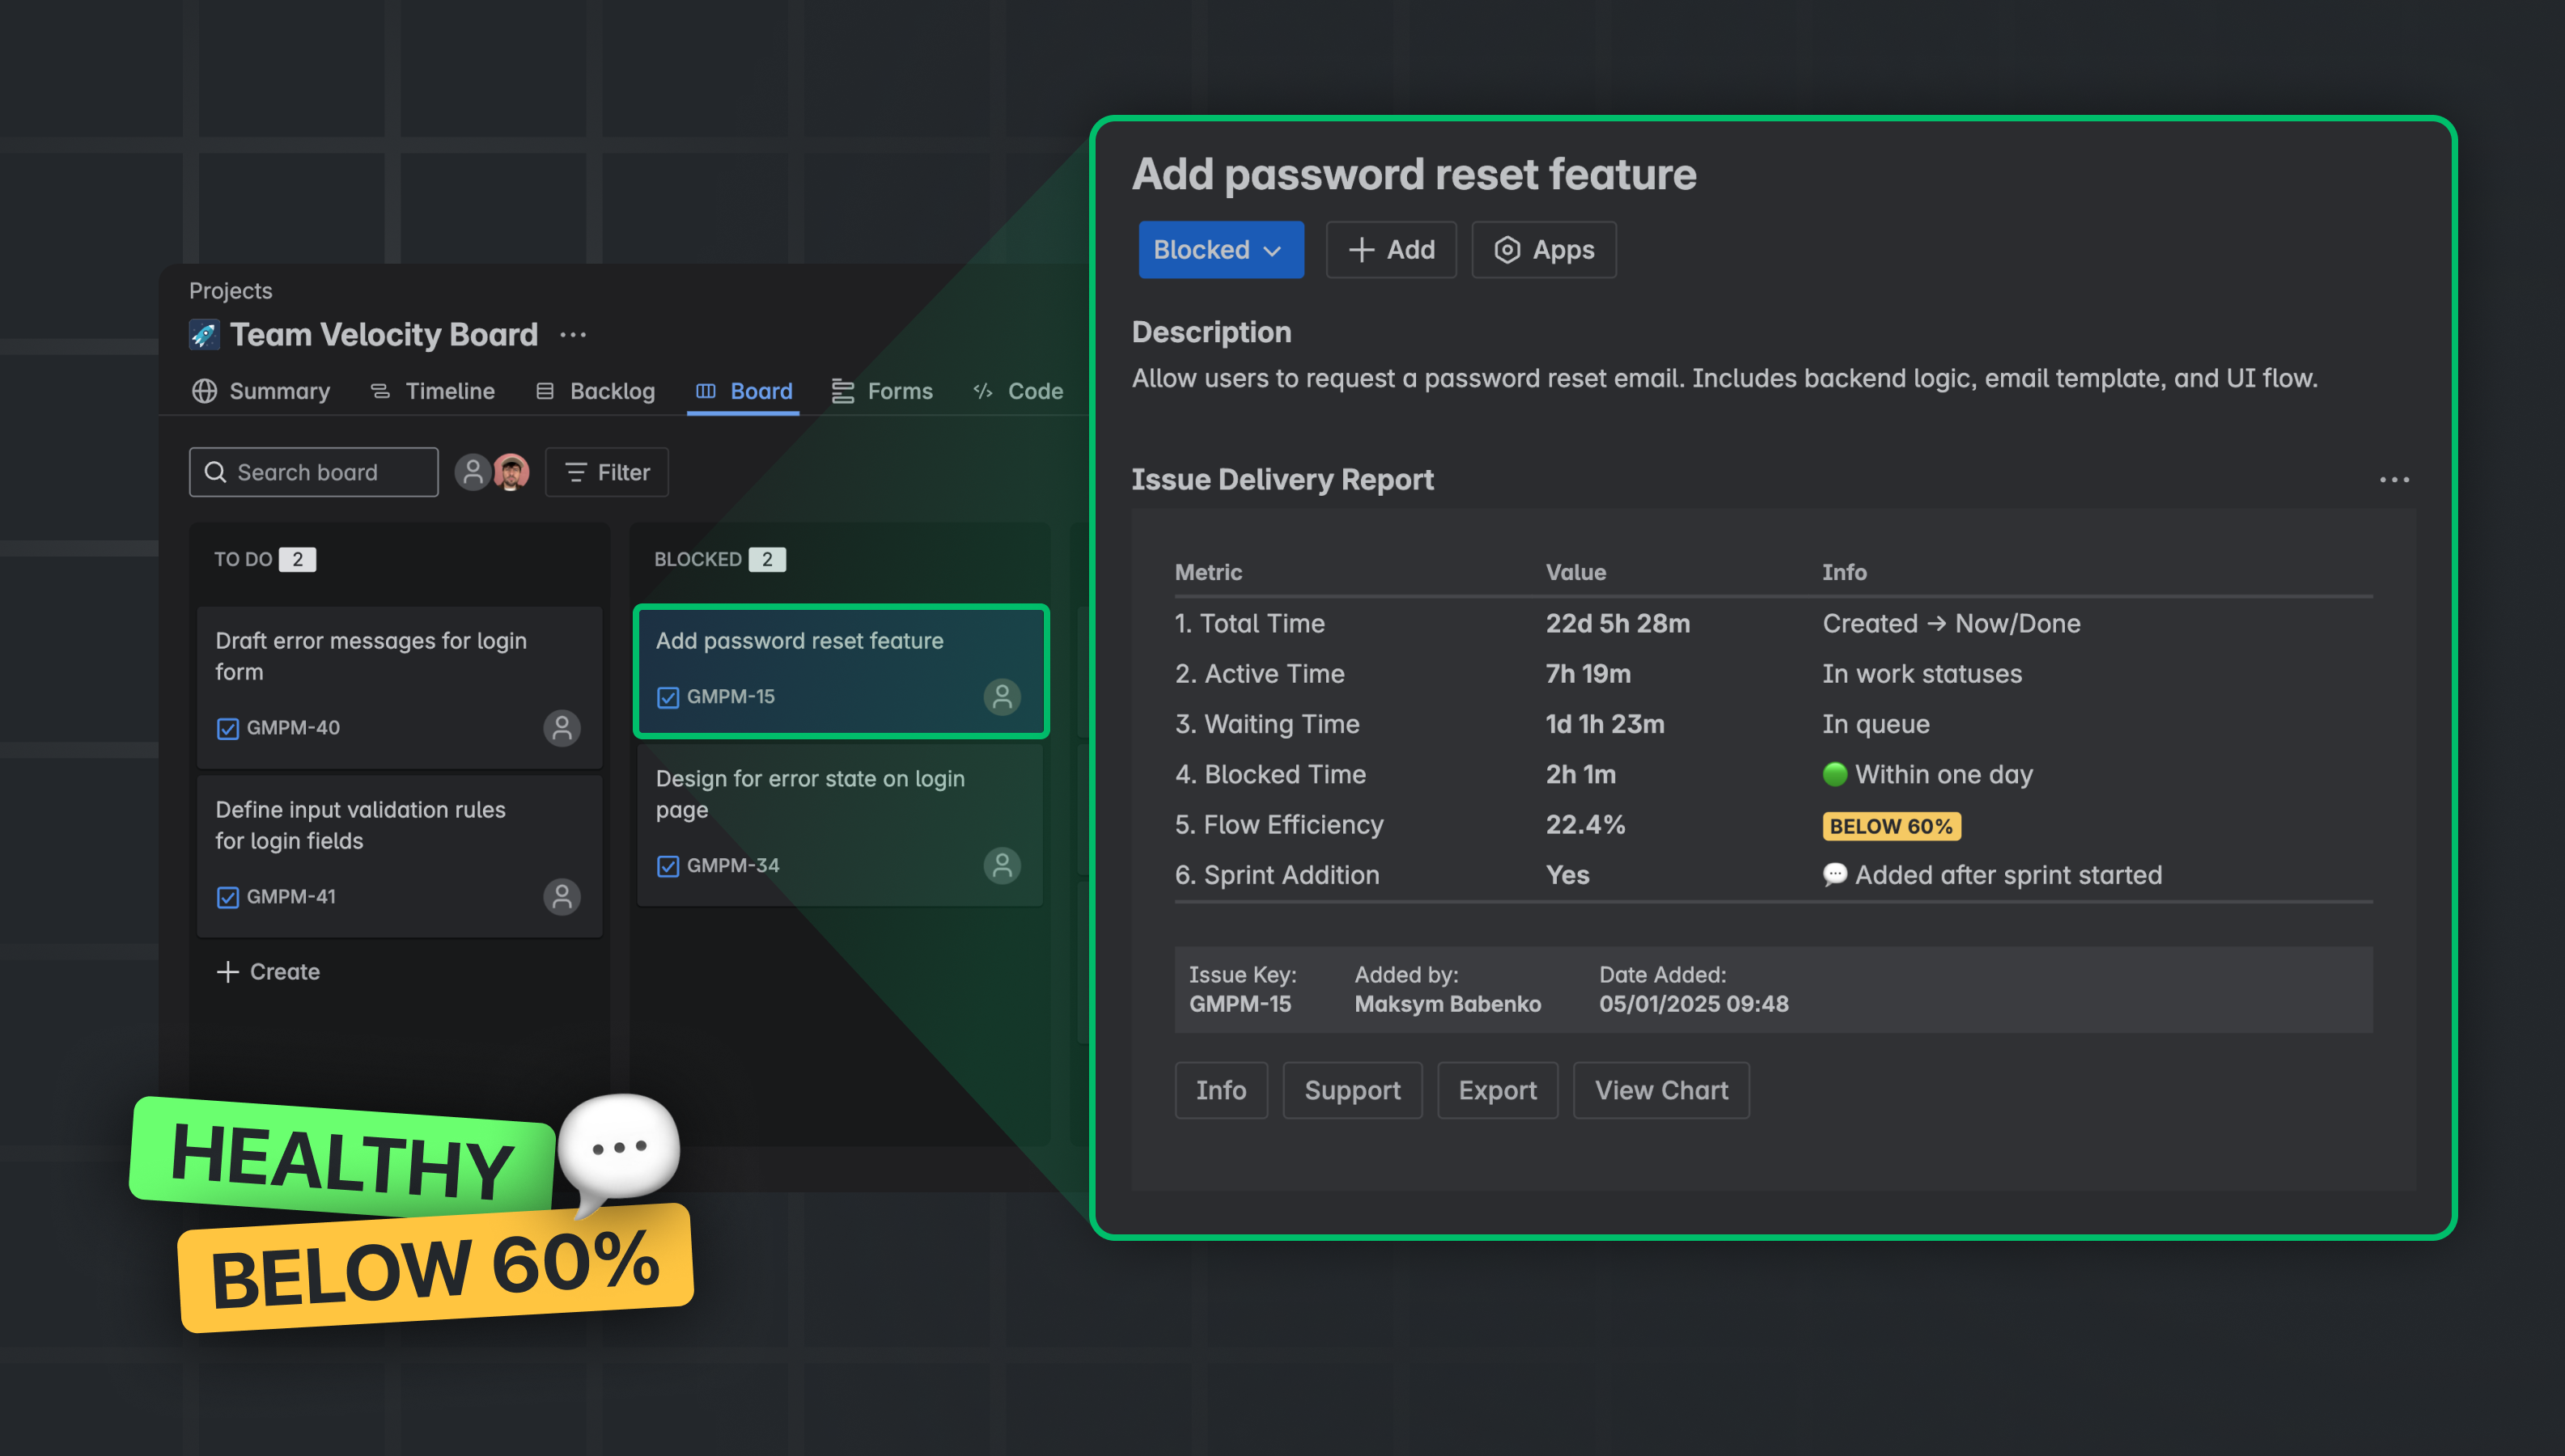
Issue Delivery Report goes beyond traditional "time in status." It pulls the entire changelog of the issue, reconstructs its timeline, and categorizes time into:
-
Active (e.g. coding, designing, reviewing)
-
Waiting (e.g. backlog, ready, open)
-
Blocked (e.g. paused, needs info)
It also calculates:
-
Total time from creation to now (Lead Time)
-
Flow Efficiency (% of time spent actively working)
-
Whether the issue was added before or after sprint start
-
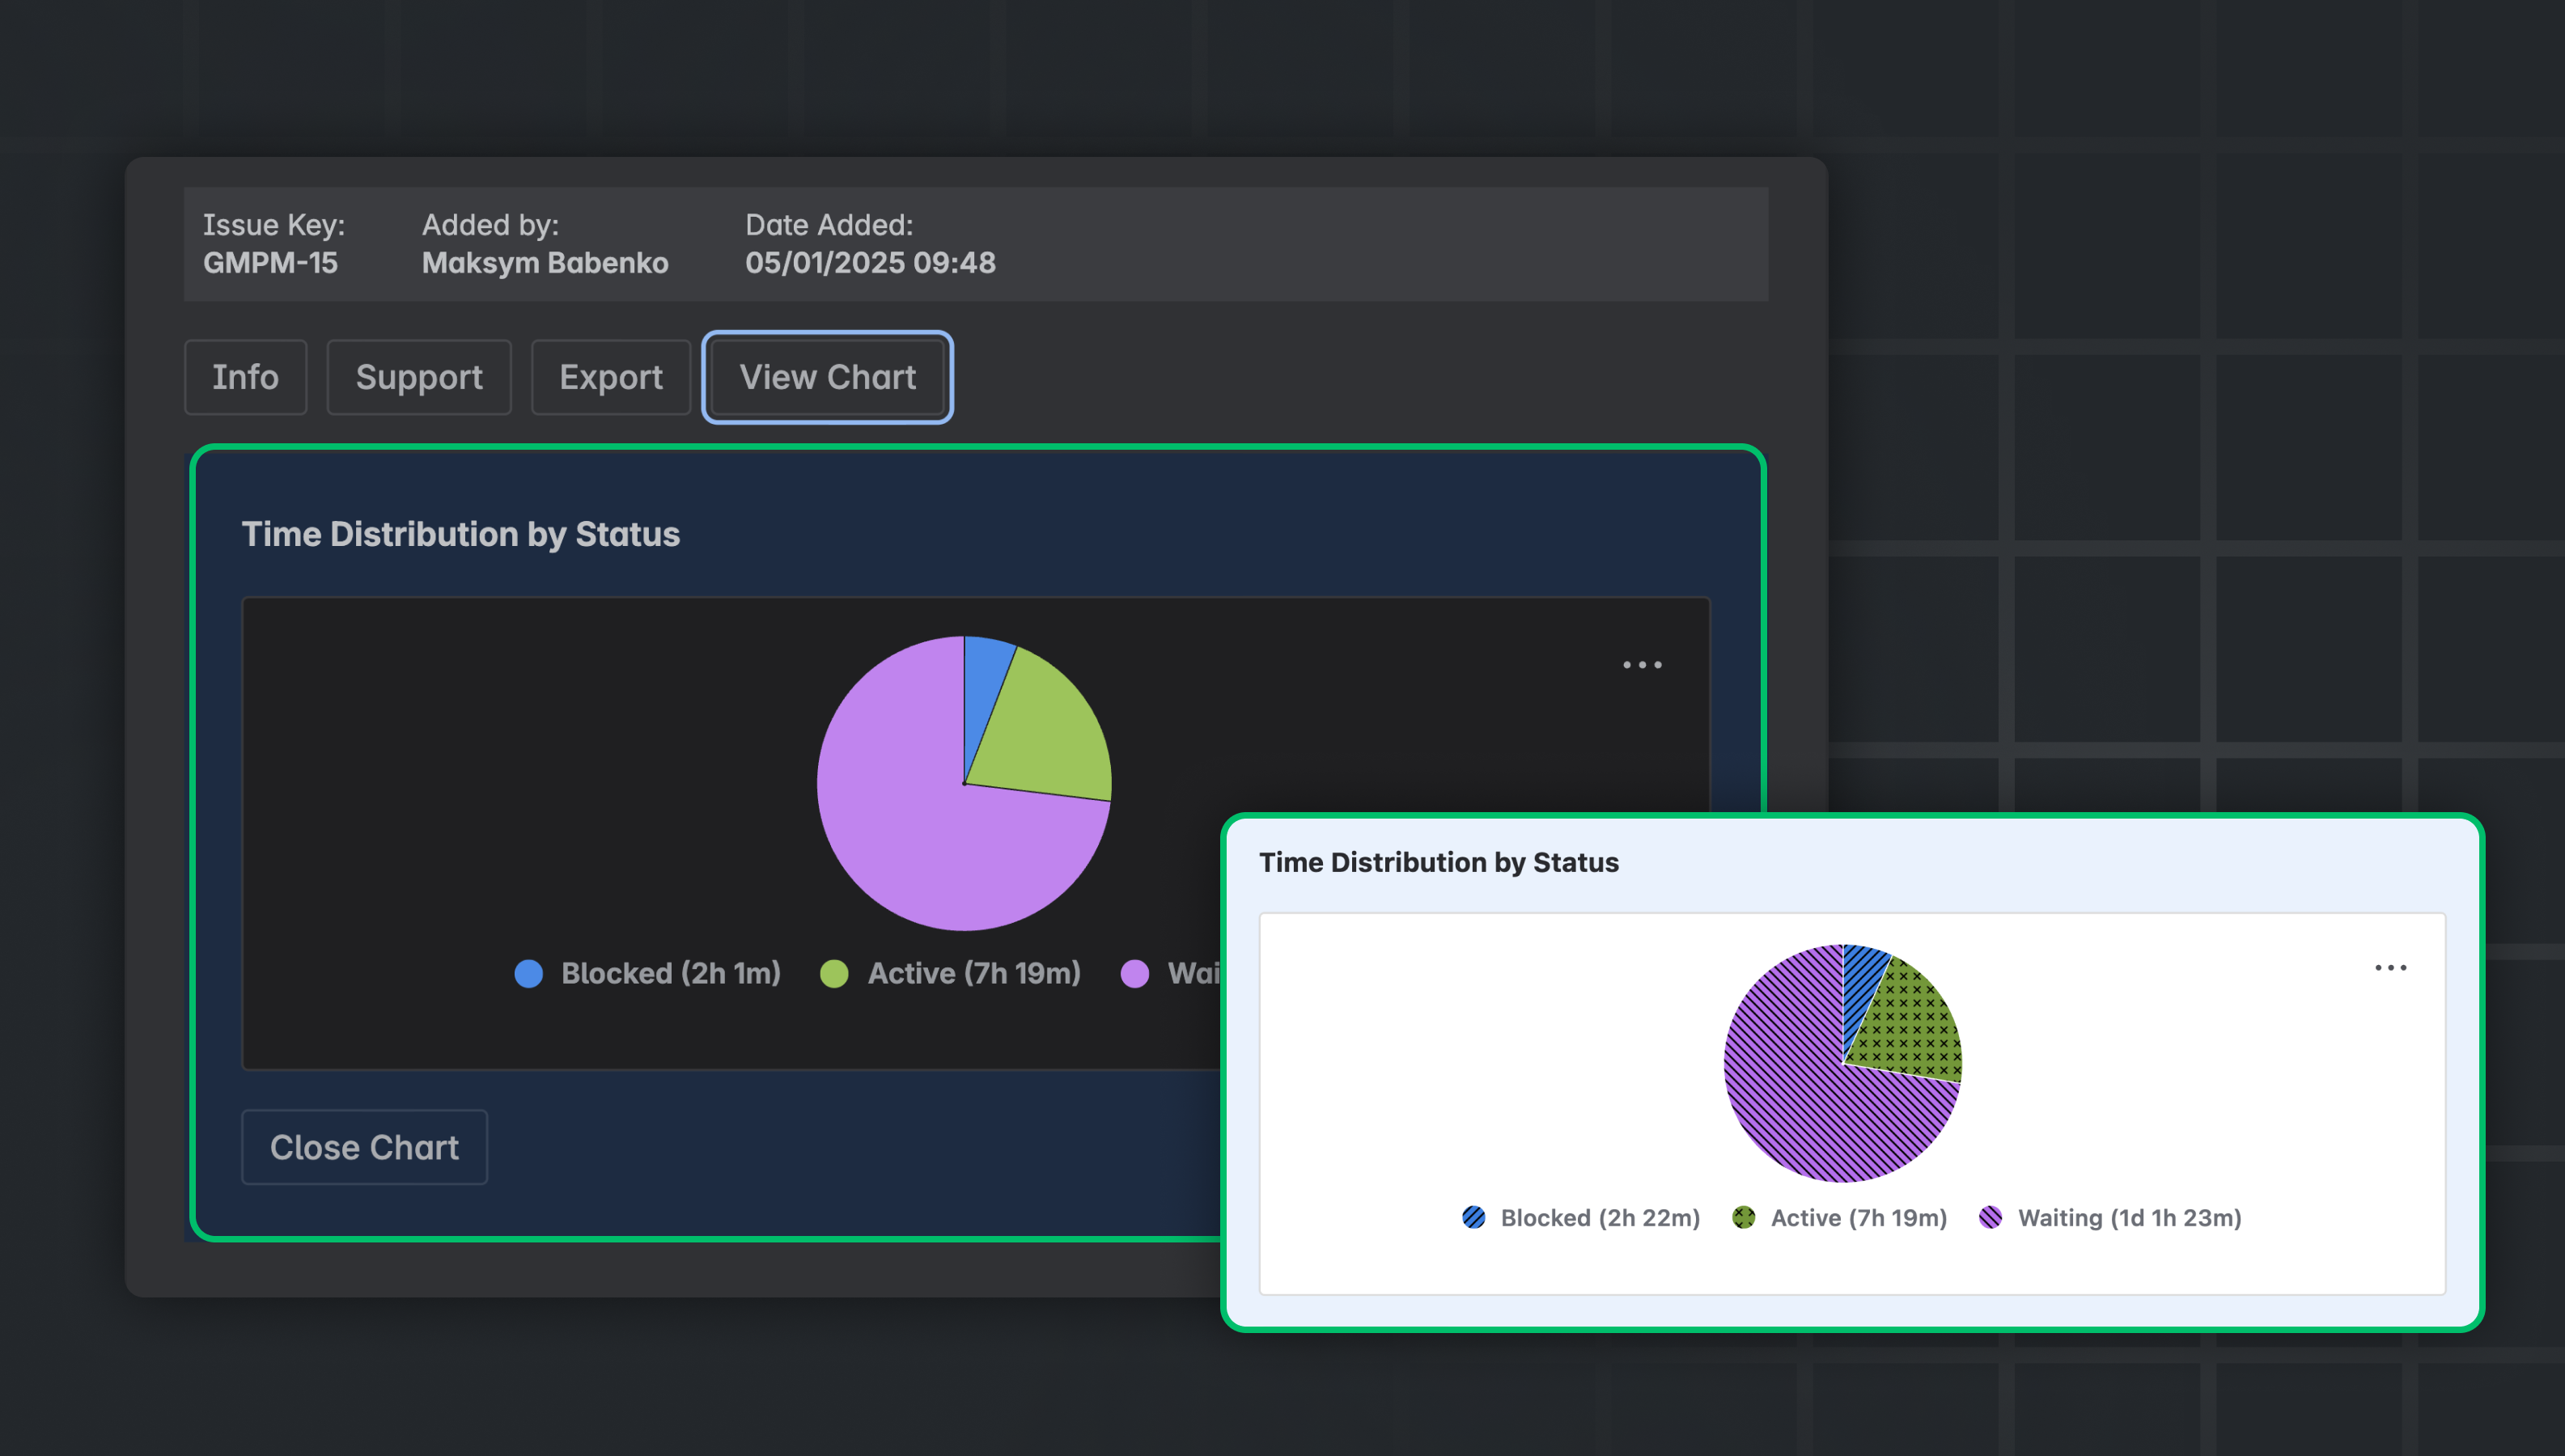
Time distribution chart: a pie chart showing how much time was spent in each phase (Active, Waiting, Blocked)
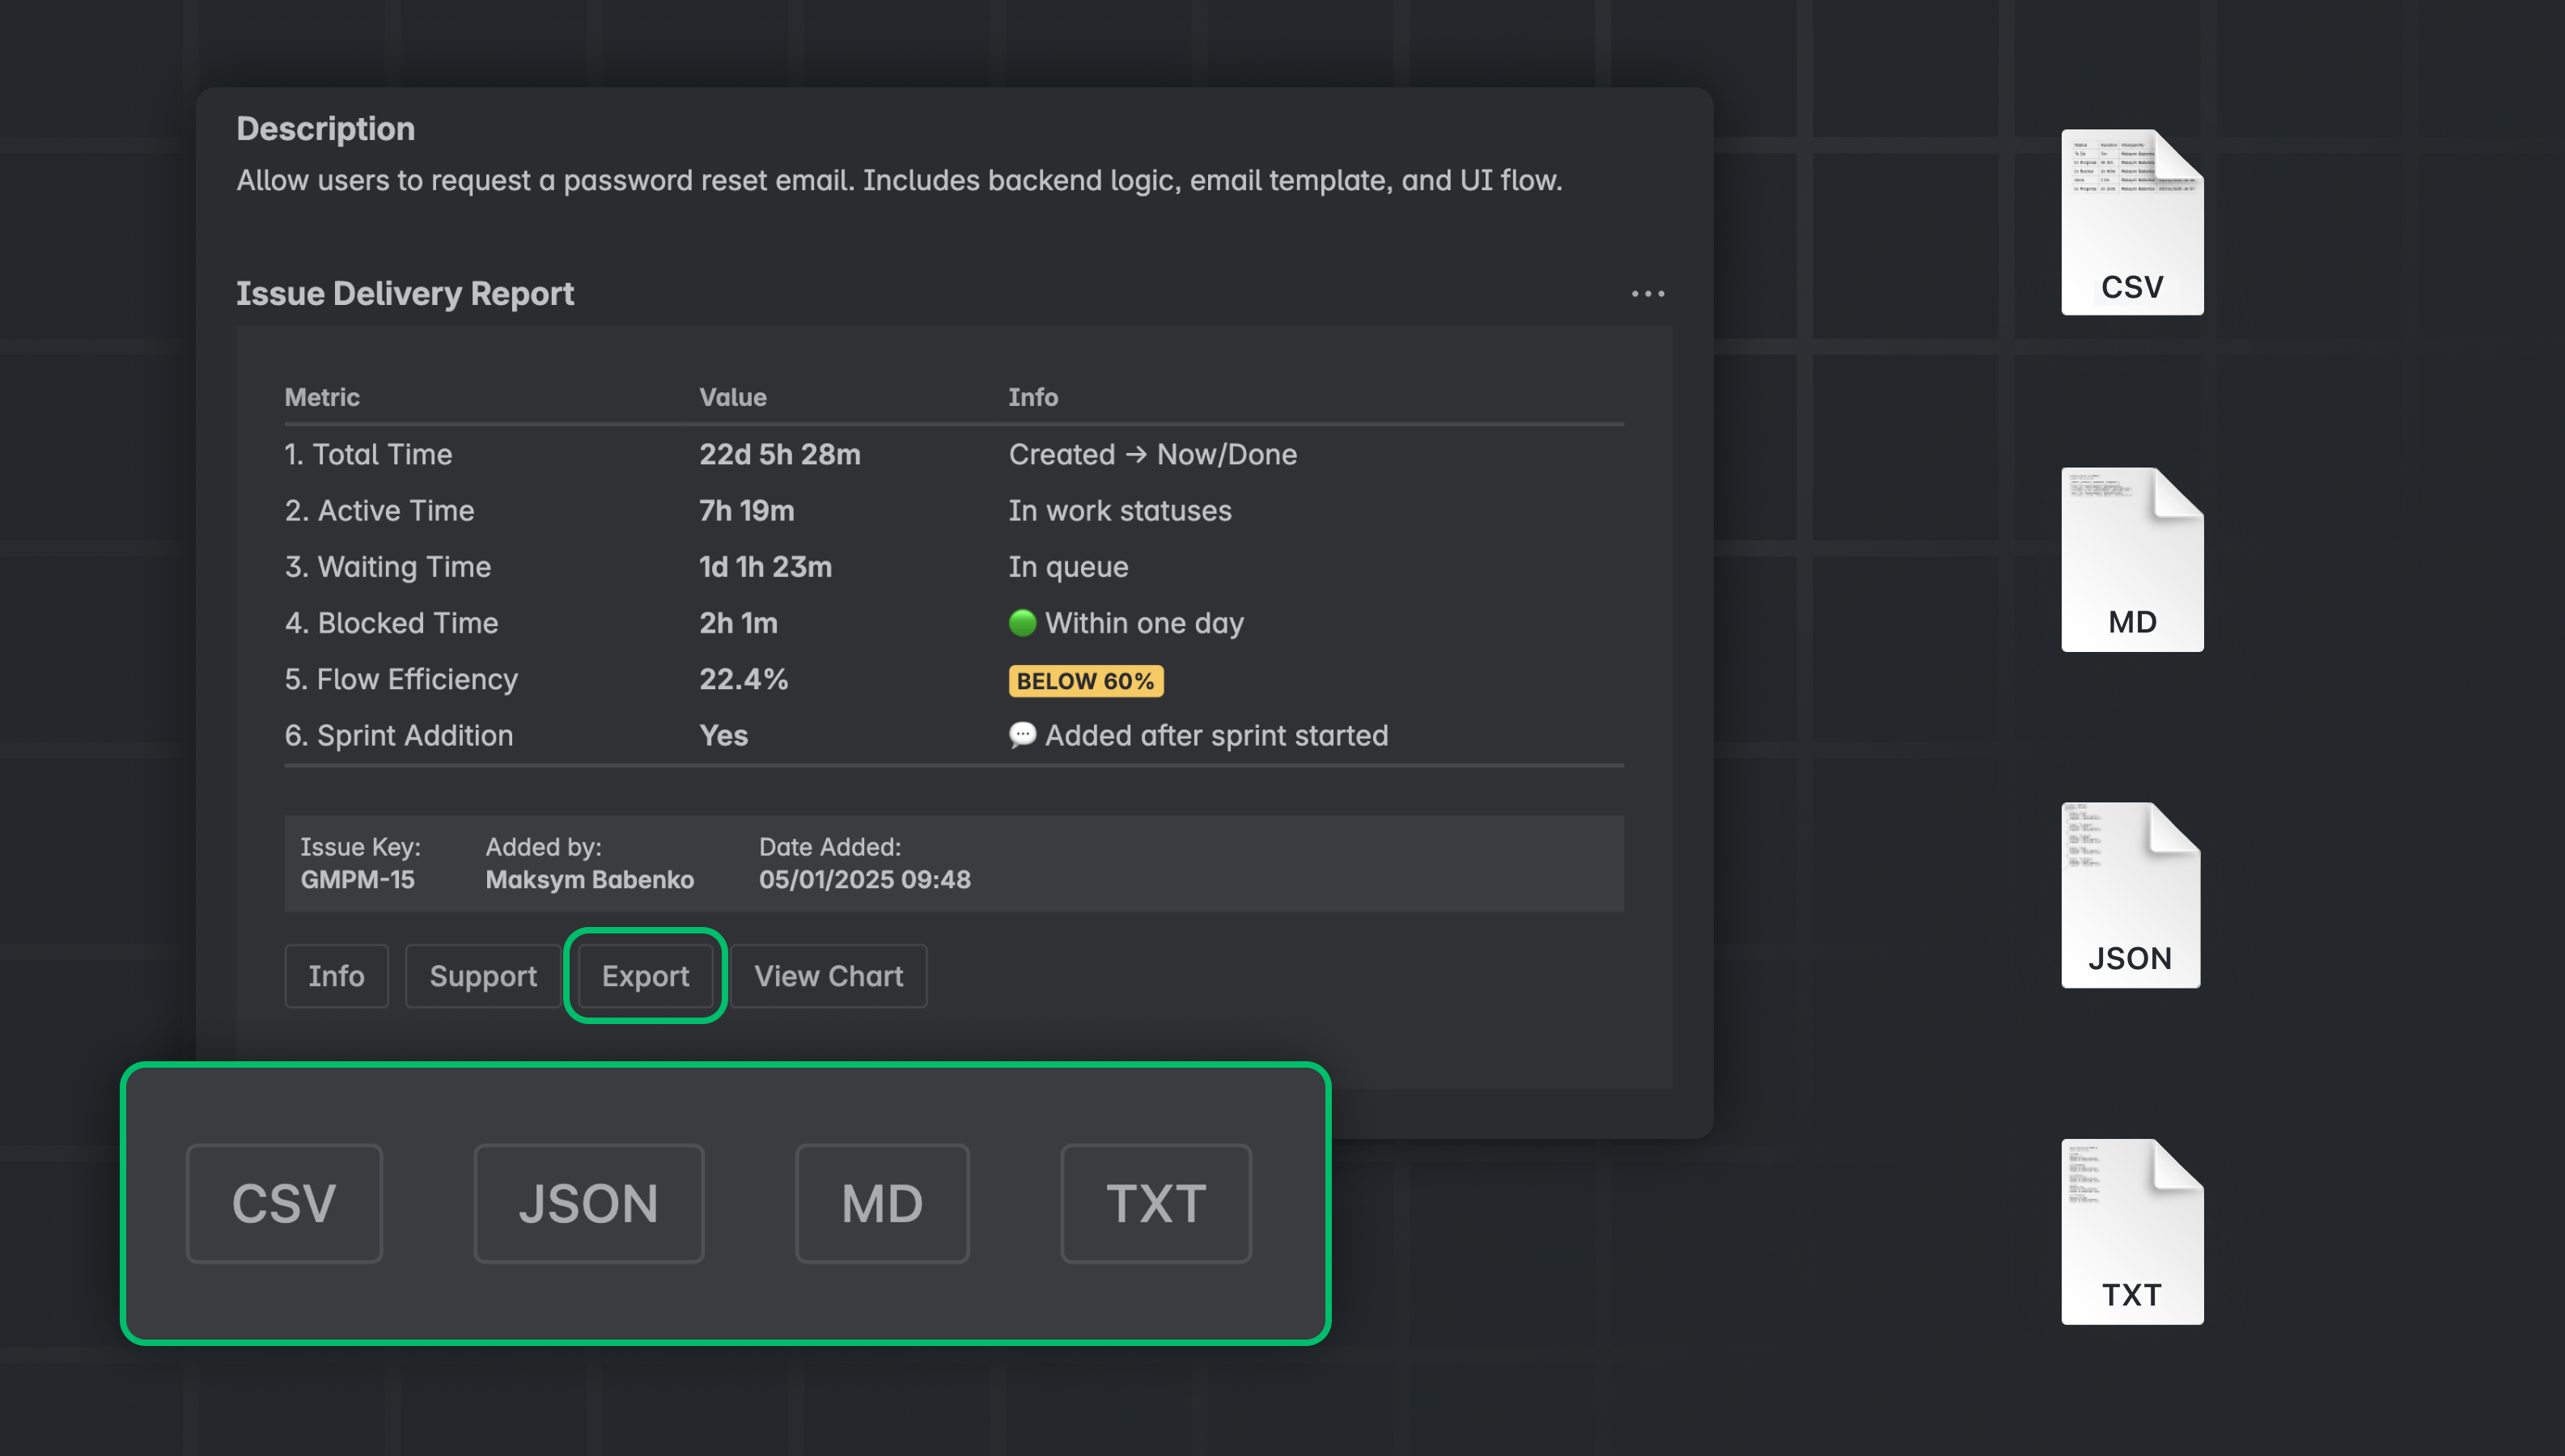
You can export results in CSV, JSON, Markdown, or TXT great for reporting or retros.
Real-World Examples
Example 1: The Bug That “Moved Fast” But Didn’t
A critical bug was marked "In Progress" quickly and the team assumed it was nearly done. But the report revealed:
🔍 What they discovered: QA wasn’t notified it was ready.
✅ How they fixed it: They added a rule to tag QA team when moving to "Ready for QA".
Example 2: Last-Minute Sprint Additions = Trouble
The report showed 4 issues were added to the sprint after it had already started.
🔍 What they discovered: Last-minute additions overwhelmed the team and derailed the plan.
✅ How they fixed it: They now limit mid-sprint changes and use the app to track any additions.
Key Features of Issue Delivery Report
-
Pie Chart View: Visualize how much time was Active, Waiting, or Blocked
-
Sprint Insights: Know if the issue was added late with author and timestamp
-
Efficiency Warnings: Highlight low flow efficiency (<60%)
- Status Category Breakdown: Time is calculated per status and grouped into Active, Waiting, Blocked, and Done using the full changelog.
How to Use It in Agile Practice
👉 Sprint Planning
👉 Daily Standups
👉 Retrospectives
-
Export and review top delayed issues
-
Categorize delays: handoffs, blockers, or scope creep?
👉 Stakeholder Reporting
🚀 Get Started
Issue Delivery Report is available on the Atlassian Marketplace.
🆓 Install Issue Delivery Report on Atlassian Marketplace
Let your Jira issues tell the full story from first status to final delivery. Then use that story to build better workflows.
