This week in our Report of the Week series, we're spotlighting a must-have visualization for service teams: the Weekly SLA Resolution Performance report. It's built to help you monitor how teams are keeping up with SLA resolution targets—week by week.
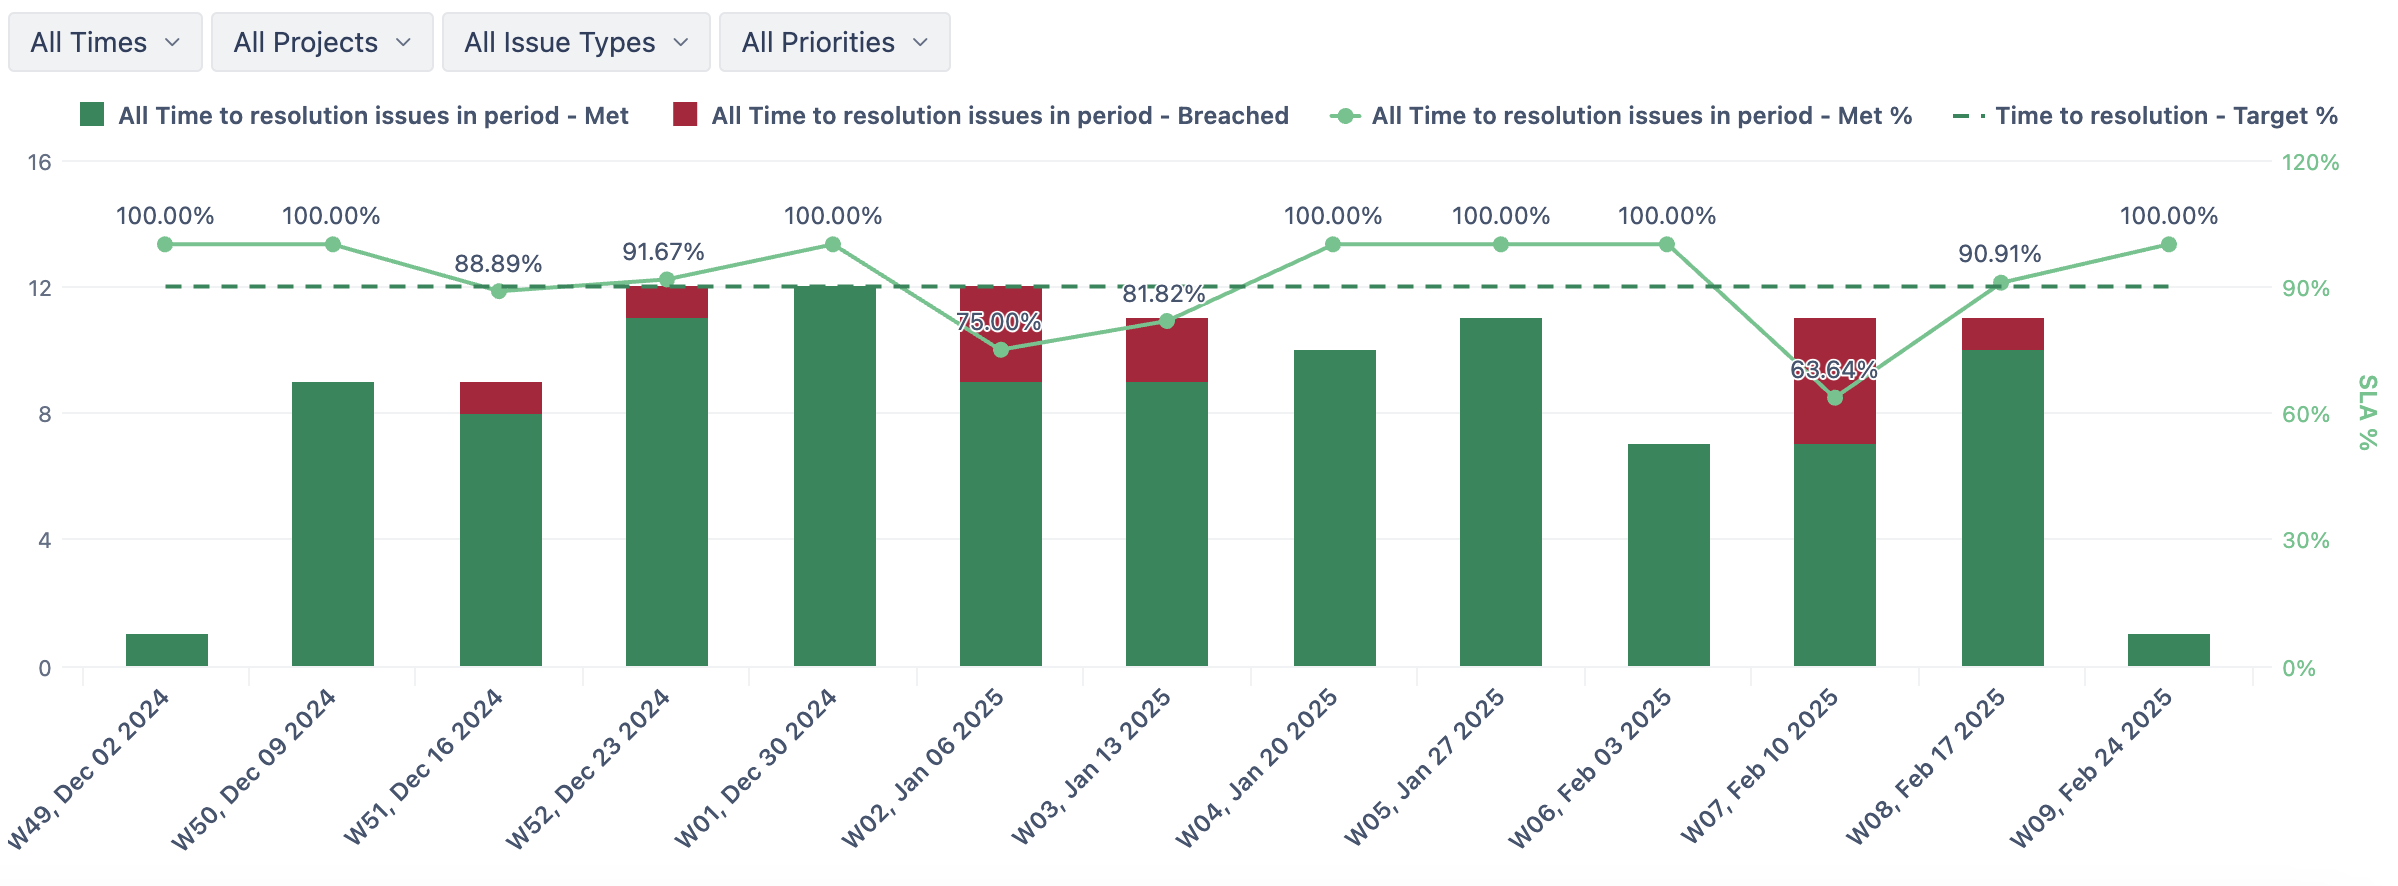
The report tracks SLA performance for issue resolution using a clear, color-coded breakdown:
-
🟩 Green Bars: Number of issues that met the resolution SLA
-
🟥 Red Bars: Number of issues that breached the SLA
-
📈 Green Line: Percentage of issues that met the SLA
-
📏 Dashed Green Line: Target SLA compliance percentage
📆 Organized by Time for Trend Visibility
Customize your view with filters for:
-
Time period – All Times, Last 4 Weeks, Current/Previous Month, or custom range
-
Projects, Issue Types, and Priorities – All fully filterable
🌟 Why This Report Matters
This visualization offers an actionable view of how well your team is adhering to resolution time SLAs. It is also is applicable for other important SLA you have defined (e.g. Time to first response).
✅ Identify trends and anomalies in SLA performance
✅ Pinpoint weeks with compliance issues and drill into details for further exploration
✅ Take corrective action before small drops turn into bigger problems
📉 Want better visibility into your SLA performance? Try this report in your eazyBI dashboard and take control of your service metrics!
Stay tuned for next week’s Report of the Week—and as always, share your feedback and insights with the community! 🚀
