A solid project management report isn’t just another document—it’s what keeps everyone aligned, drives better decisions, and ensures your project stays on course. Whether you need a quick status update, a deep dive into progress, or a risk assessment, the right report makes all the difference.
The problem? Many Jira reports are cluttered, long-winded, and tough to act on. A structured, data-driven approach can change that. And with the right tool—like ActivityTimeline—you can streamline reporting with automated insights, real-time data, and clear visuals.
Define Your Report’s Purpose
Not all reports serve the same goal. Who’s reading it, and what do they need to know?
- Project managers track progress and roadblocks.
- Stakeholders want high-level updates.
- Teams need insights into milestones and workload.
Start with the end in mind. The more focused your report, the more useful it becomes.
Structure Your Reports for Clarity
Messy reports lead to messy decisions. Keep things structured so stakeholders can find key details at a glance. A strong report typically includes:
- Summary: A snapshot of the project’s status.
- Key Metrics: Milestones, budget, and resource utilization.
- Risks & Roadblocks: Potential delays and their impact.
- Next Steps: Clear actions to move forward.
Consistency makes reports easier to compare and track over time.
Track Project Progress with Real-Time Data
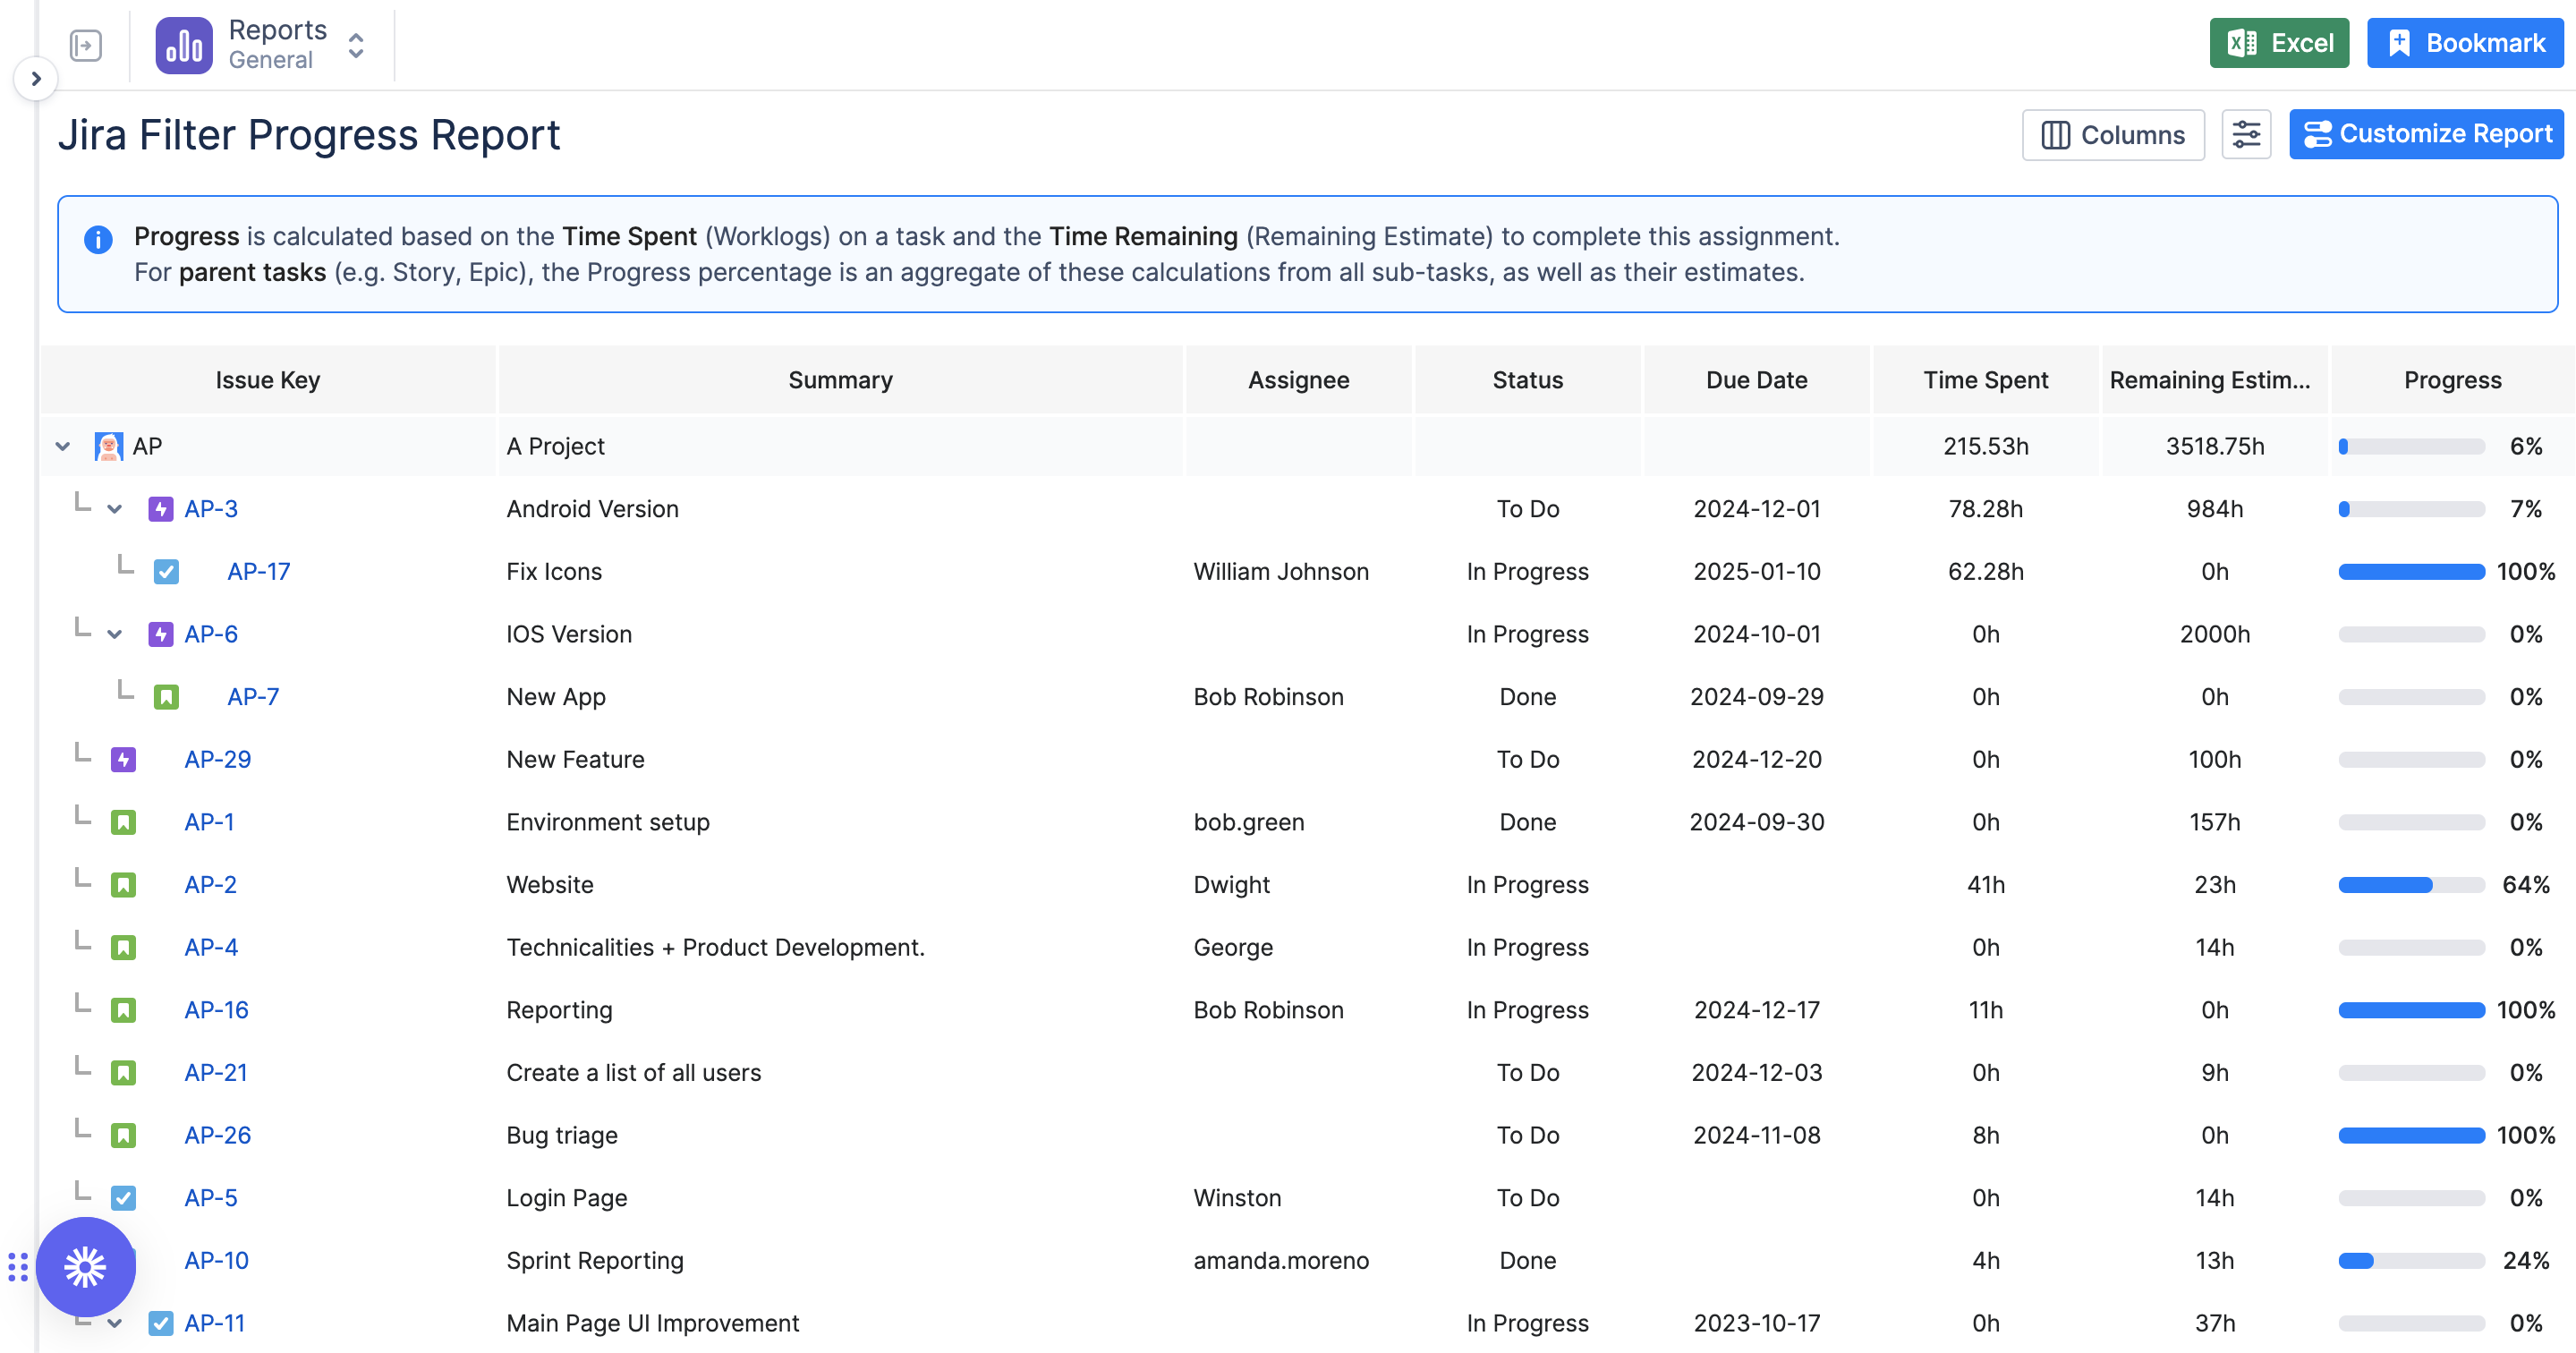
Think of a project progress report like a GPS—it tells you if you’re on track. ActivityTimeline’s Project Progress Report gives a visual breakdown of work across projects, epics, and tasks. You can:
- Track completed vs. pending tasks.
- Customize fields for a tailored view.
- Hide completed issues for a clean report.
With real-time data from Jira’s Time Tracking field, you get an accurate picture of where things stand.
Compare Planned vs. Actual Progress
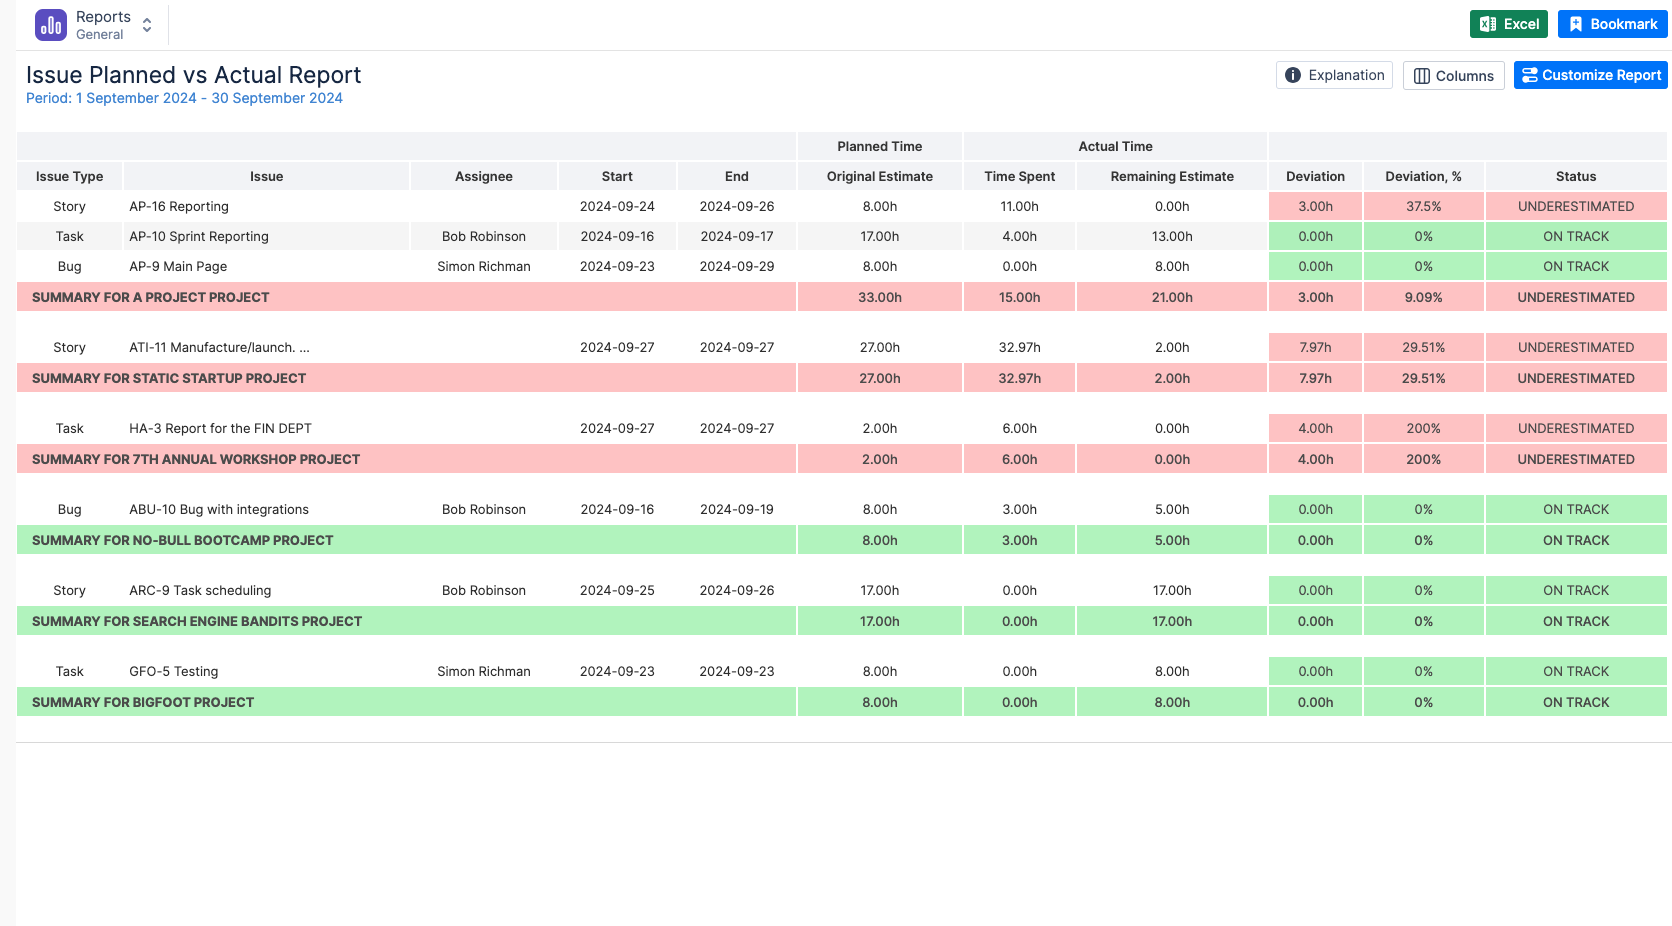
Plans are great—until reality steps in. ActivityTimeline’s Planned vs. Actual Report highlights how well estimates align with real execution.
- Compare estimates vs. actual work to refine future planning.
- Spot under or overestimated tasks to improve forecasting.
- Customize filters by team, project, or timeframe for precise insights.
If your estimates keep missing the mark, this report helps fix that.
Use Charts for Quick Insights
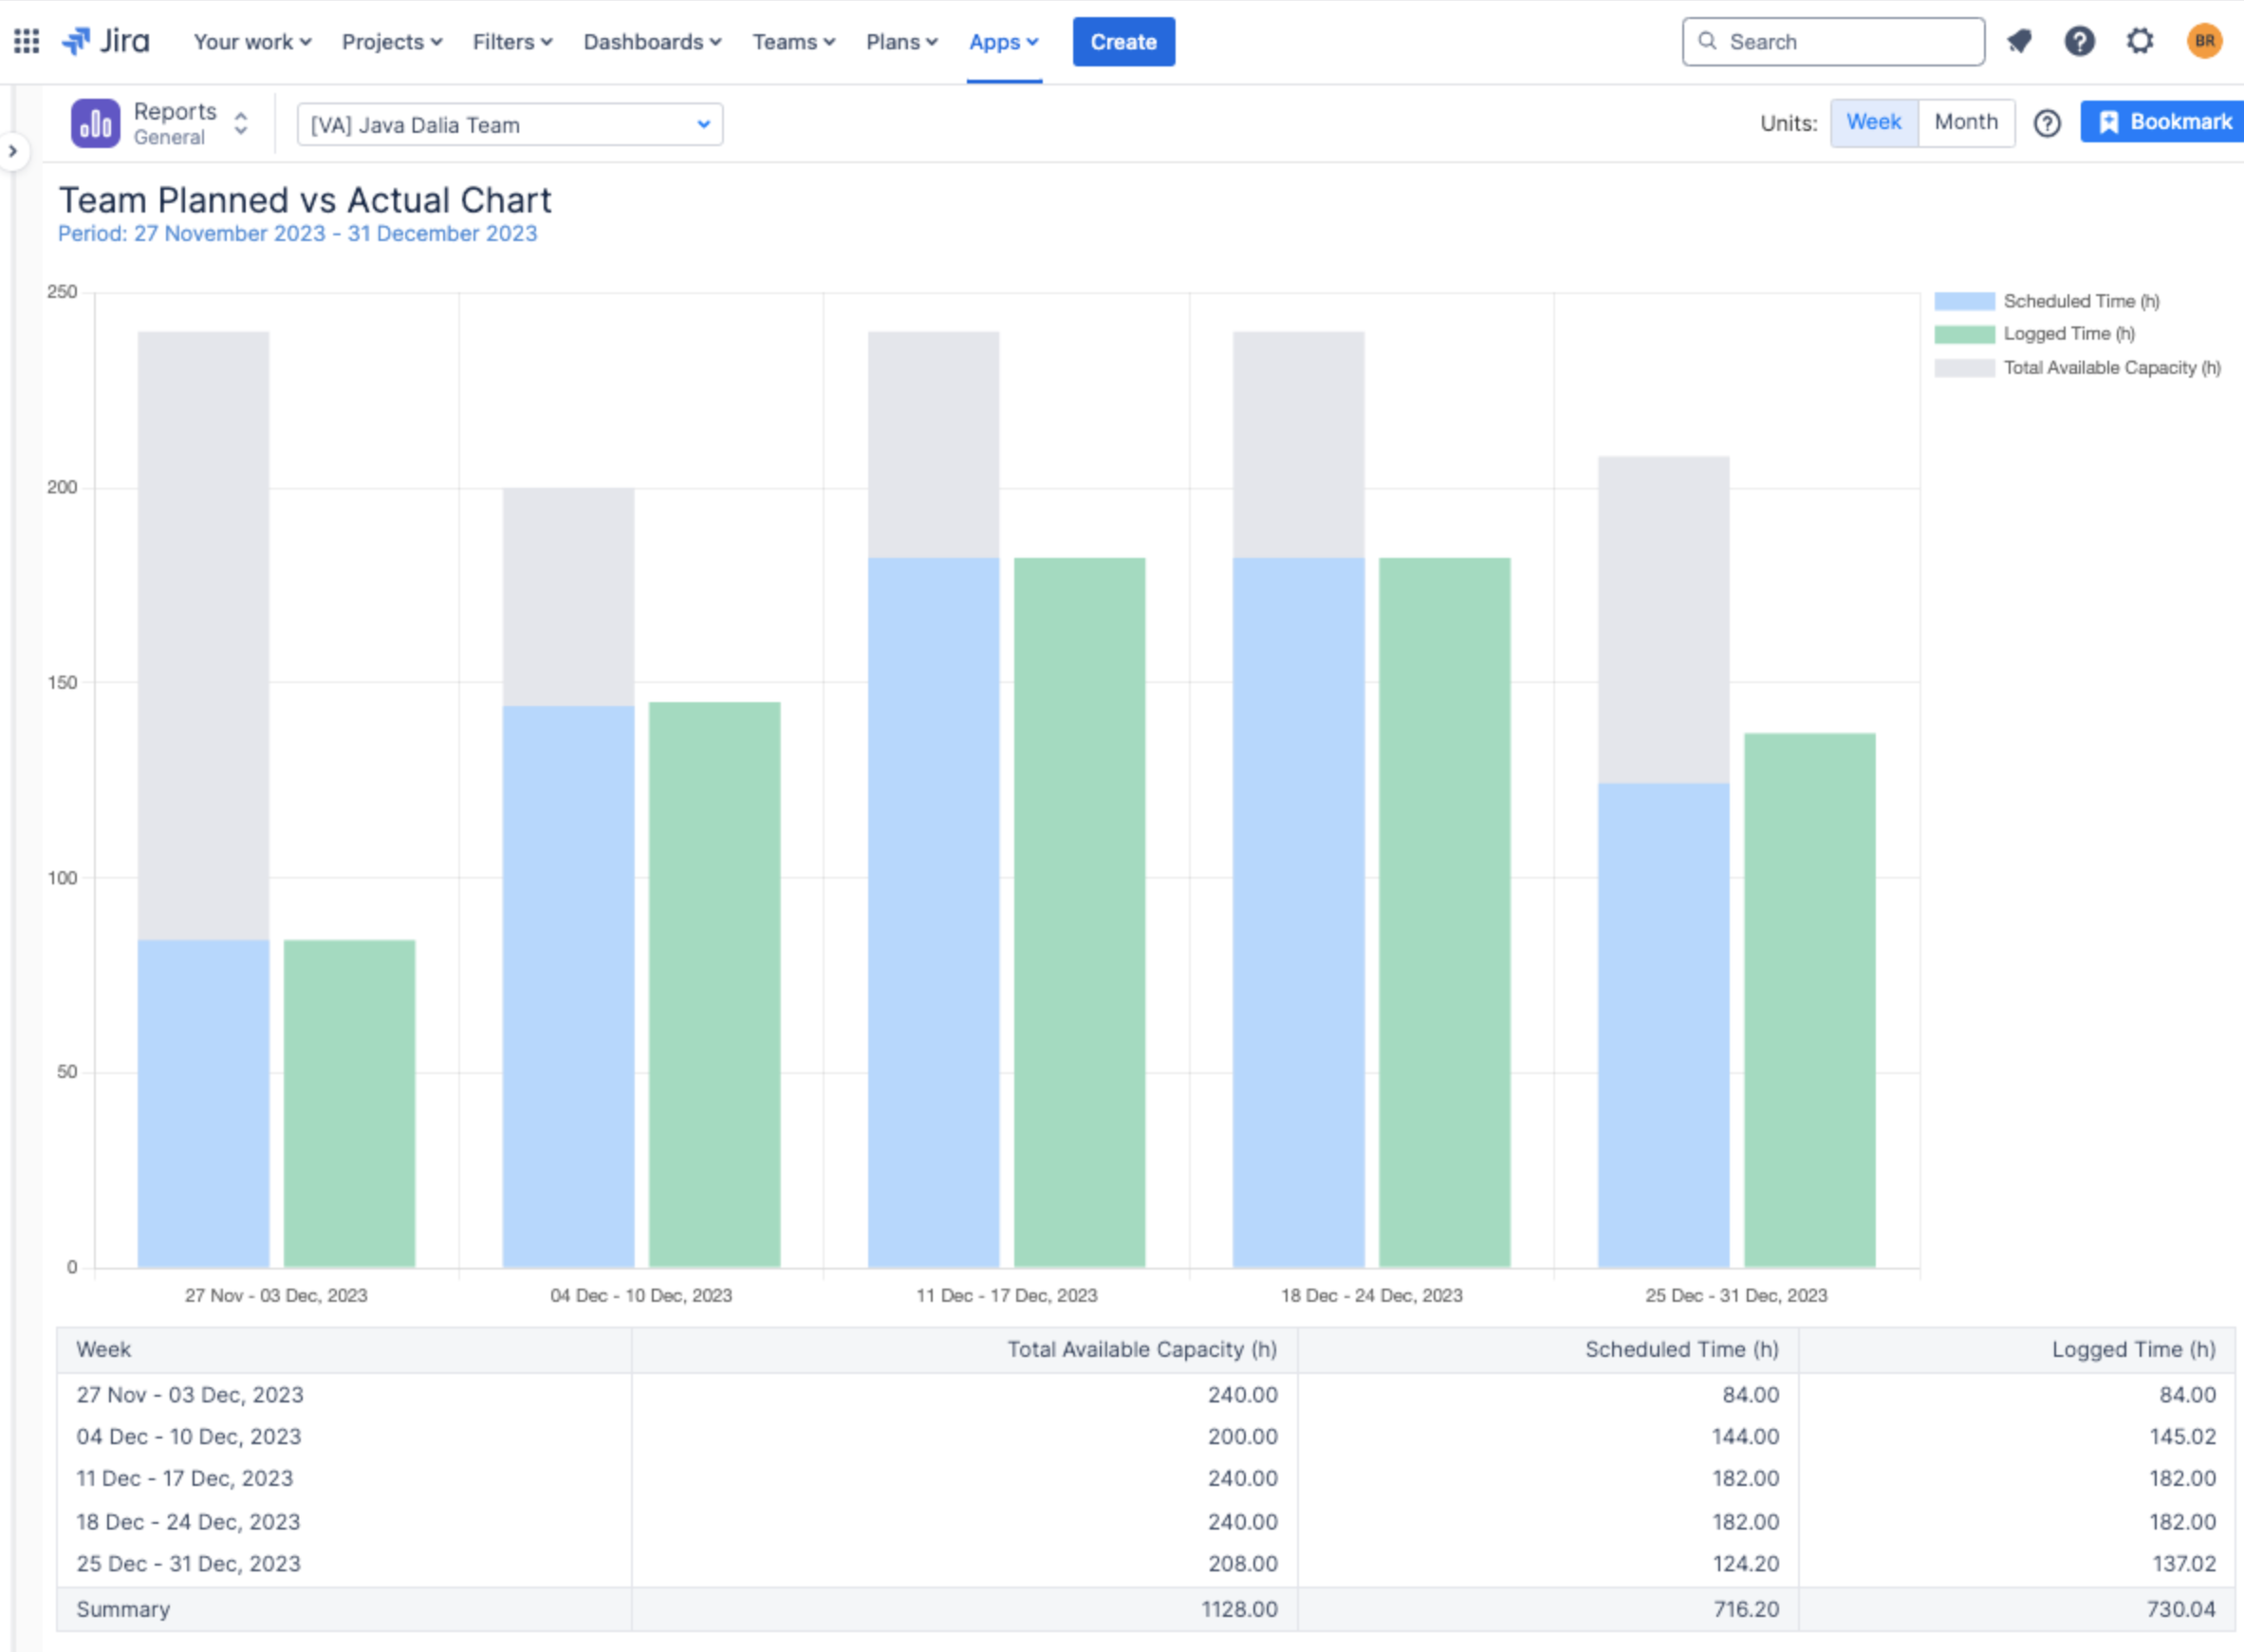
Raw numbers tell a story, but visuals make it clear. ActivityTimeline’s charts let you compare estimated vs. actual work at a glance. You can:
- Track team capacity and workload.
- Analyze scheduled vs. logged time.
- Filter by project, epic, or timeframe.
If your team planned for 23 hours but logged 40, you know adjustments are needed.
Identify Risks Before They Derail Your Project
Things rarely go 100% according to plan. The key is catching problems early. ActivityTimeline helps you:
- Spot overloaded teams before burnout sets in.
- Compare planned vs. actual work to prevent bottlenecks.
- Use risk reports to stay ahead of delays.
Proactively managing risks keeps your project moving forward smoothly.
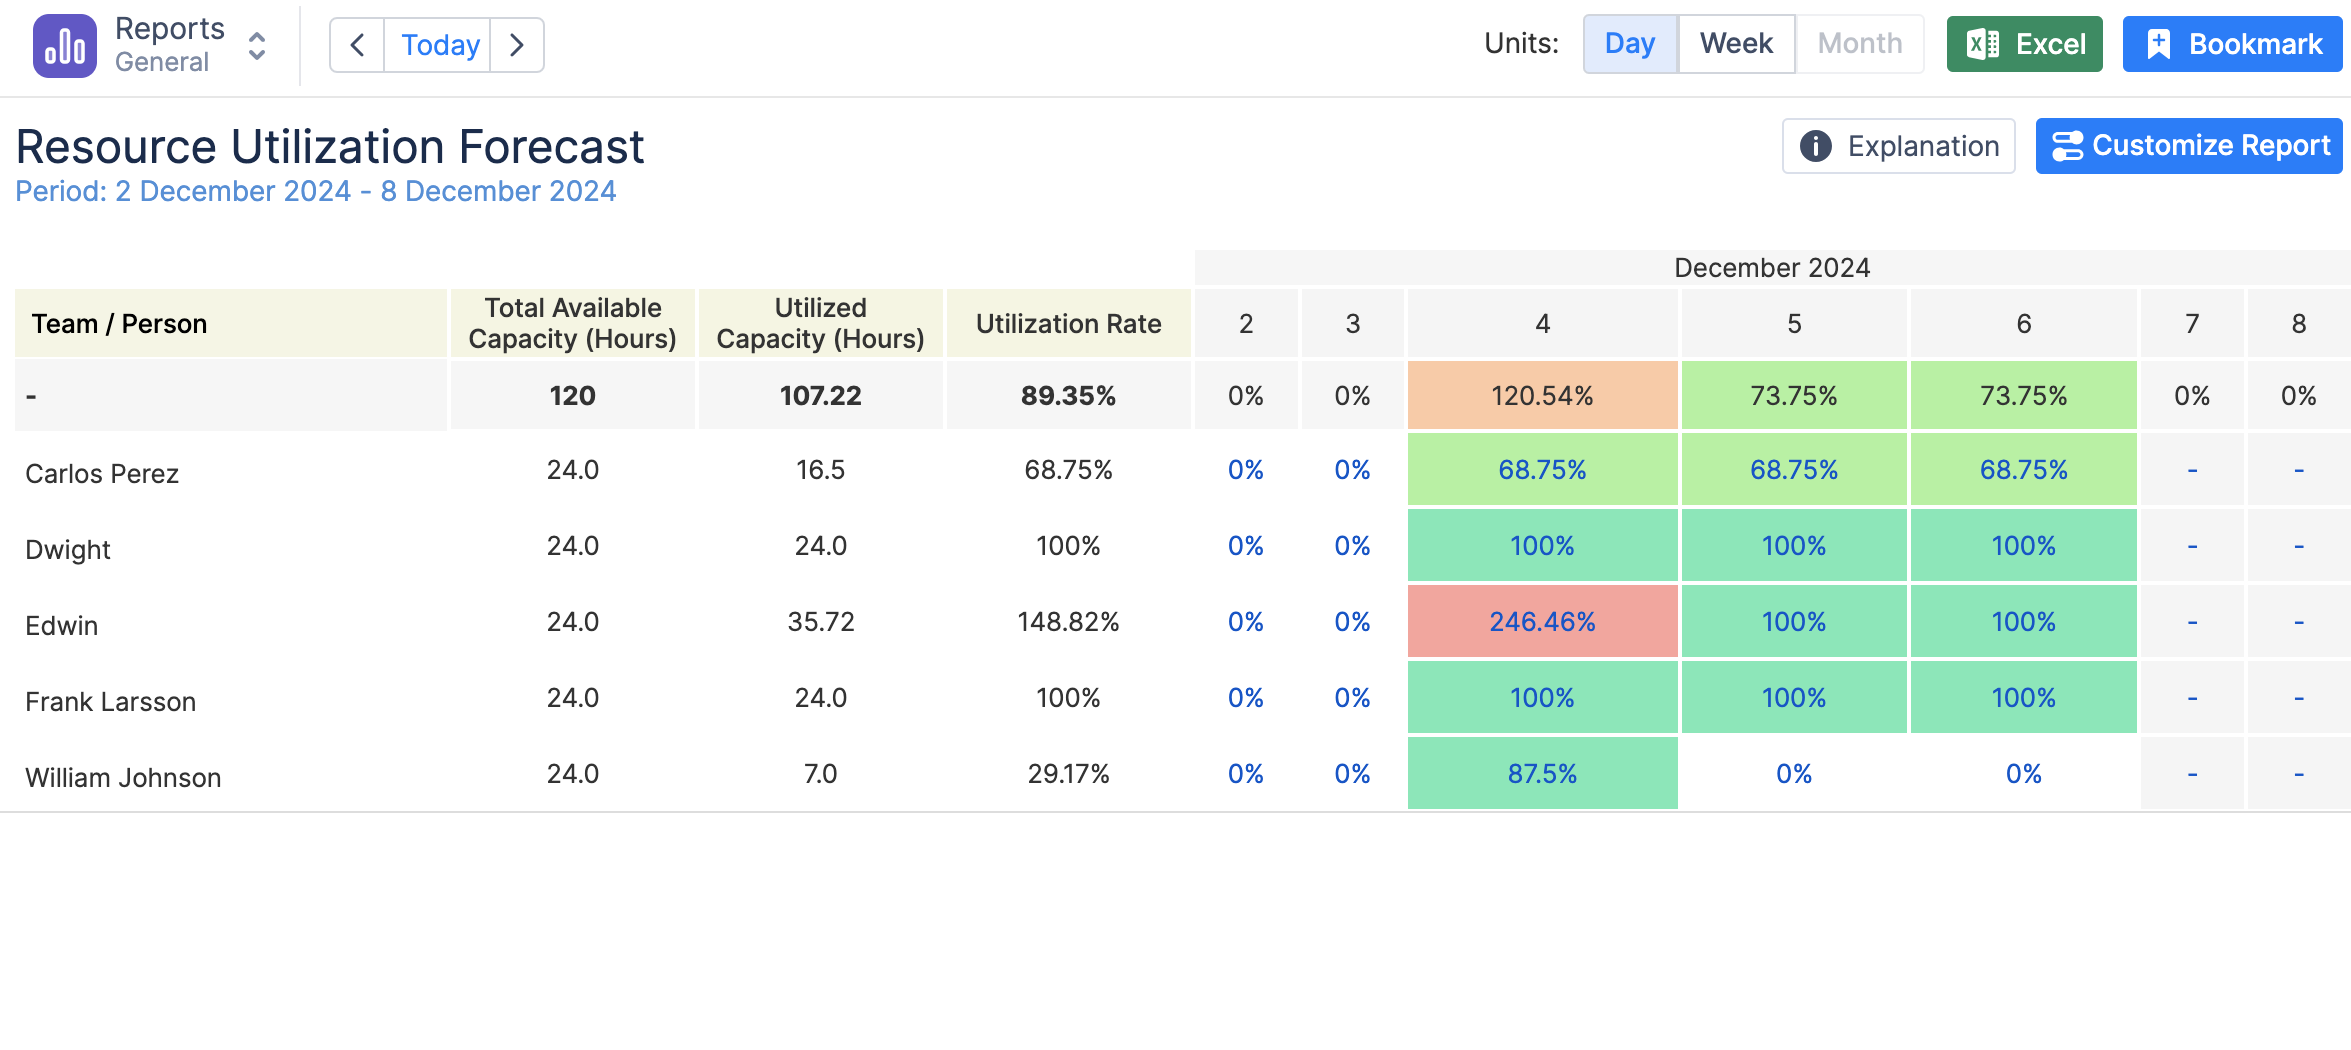
Make Reports Actionable
Reports shouldn’t just sit in a folder. They should drive action. Keep them focused with:
- Clear takeaways on risks, progress, and workload.
- Assigned ownership for follow-ups.
- Next steps that turn insights into action.
If your workload report shows an overloaded team, don’t just note it—redistribute tasks before deadlines slip.
Automate Reporting for Efficiency
Manual reporting is time-consuming. ActivityTimeline automates progress reports, resource tracking, and workload insights so you’re not digging through Jira for data. With built-in templates and dashboard integrations, you get instant access to key metrics.
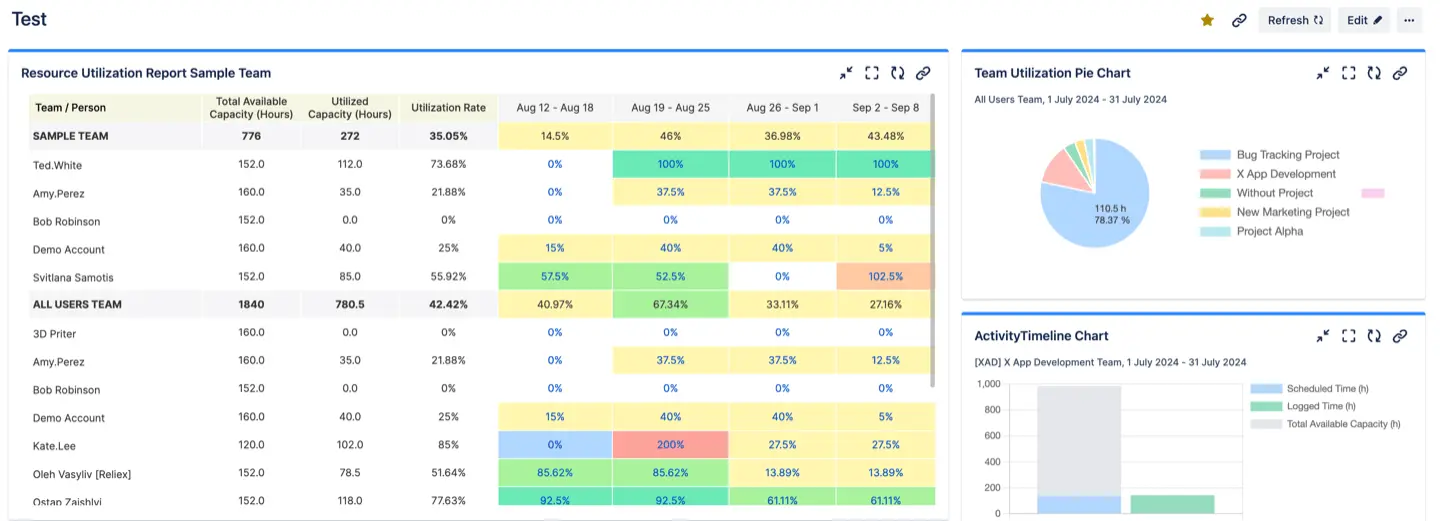
Ensure Real-Time Accuracy
Outdated reports lead to bad decisions. ActivityTimeline syncs live with Jira, so your data is always accurate. Whether tracking milestones, resource allocation, or deadlines, you’re always working with the latest info.
Keep Reports Concise
Nobody wants to read a novel-length report. ActivityTimeline’s visual summaries ensure:
- Executives get quick takeaways.
- Project managers gain actionable insights.
- Teams see exactly what needs attention.
Save and bookmark reports for instant access, keeping your reporting workflow efficient.
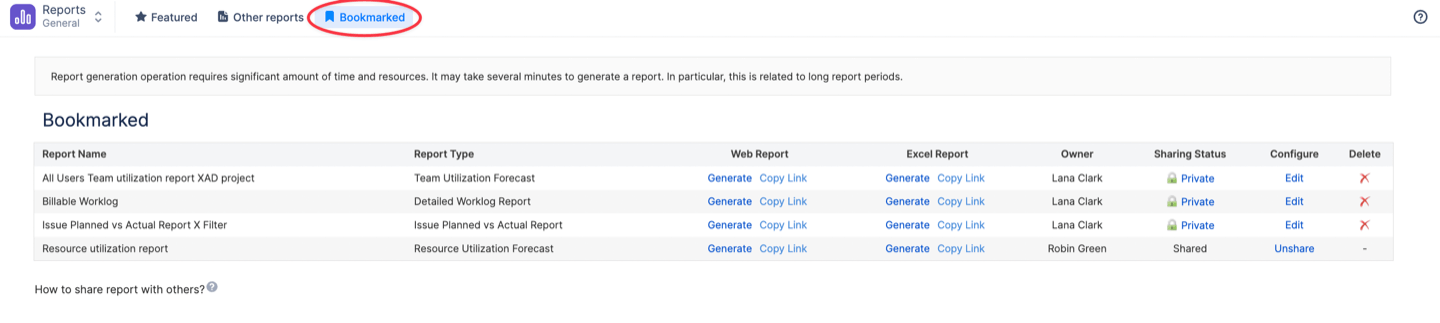
Smarter Reports, Better Decisions
Great reporting isn’t just about collecting data—it’s about making data useful. By automating reports, ensuring real-time accuracy, and keeping them concise, you create reports that drive real decisions.
ActivityTimeline bridges the gap between planning and reporting, giving teams the clarity they need to stay ahead. Ready to streamline your reporting process? Try ActivityTimeline and see the difference.

