Just like knowing how fast you're driving helps you figure out when you'll reach your destination, understanding your team's velocity helps you predict when you'll finish your projects.
Velocity in Scrum: how does it work
In Scrum, tracking velocity is pretty straightforward. Your team completes work in sprints (usually two-week chunks), and you measure how much they get done in each sprint using story points.
What teams track:
Completed story points per sprint
Sprint-over-sprint trends
Average velocity for future planning
Scope changes within sprints
What is a normal velocity for Scrum teams?
Many teams get hung up on trying to hit some magical velocity number. The truth is, a good velocity is one that your team can maintain consistently without burning out. For some teams, that might be 30 points per sprint; for others, it might be 15. What matters is the trend and stability, not the raw numbers.
Kanban velocity: continuous flow
Kanban teams work a bit differently. Instead of sprints, they focus on keeping work flowing smoothly. And when Kanban teams track velocity, it’s not in the same way Scrum teams do.
Instead of sprint-based velocity, they often look at throughput - how many items they complete in a given period. Some teams use "flow velocity," measuring how quickly work moves through their system.
Key metrics for Kanban velocity tracking:
Throughput over custom time periods (weekly/monthly)
Story points or issues completed
Cycle time for different work types
WIP (Work in Progress) limits
Measuring team and cross-team velocity in JIRA
JIRA's built-in velocity chart
JIRA has been shipping with its own velocity chart since way back. It's like the trusty Toyota of velocity tracking—reliable, gets the job done, but pretty basic. You get to see what your team promised to deliver and what they actually finished.
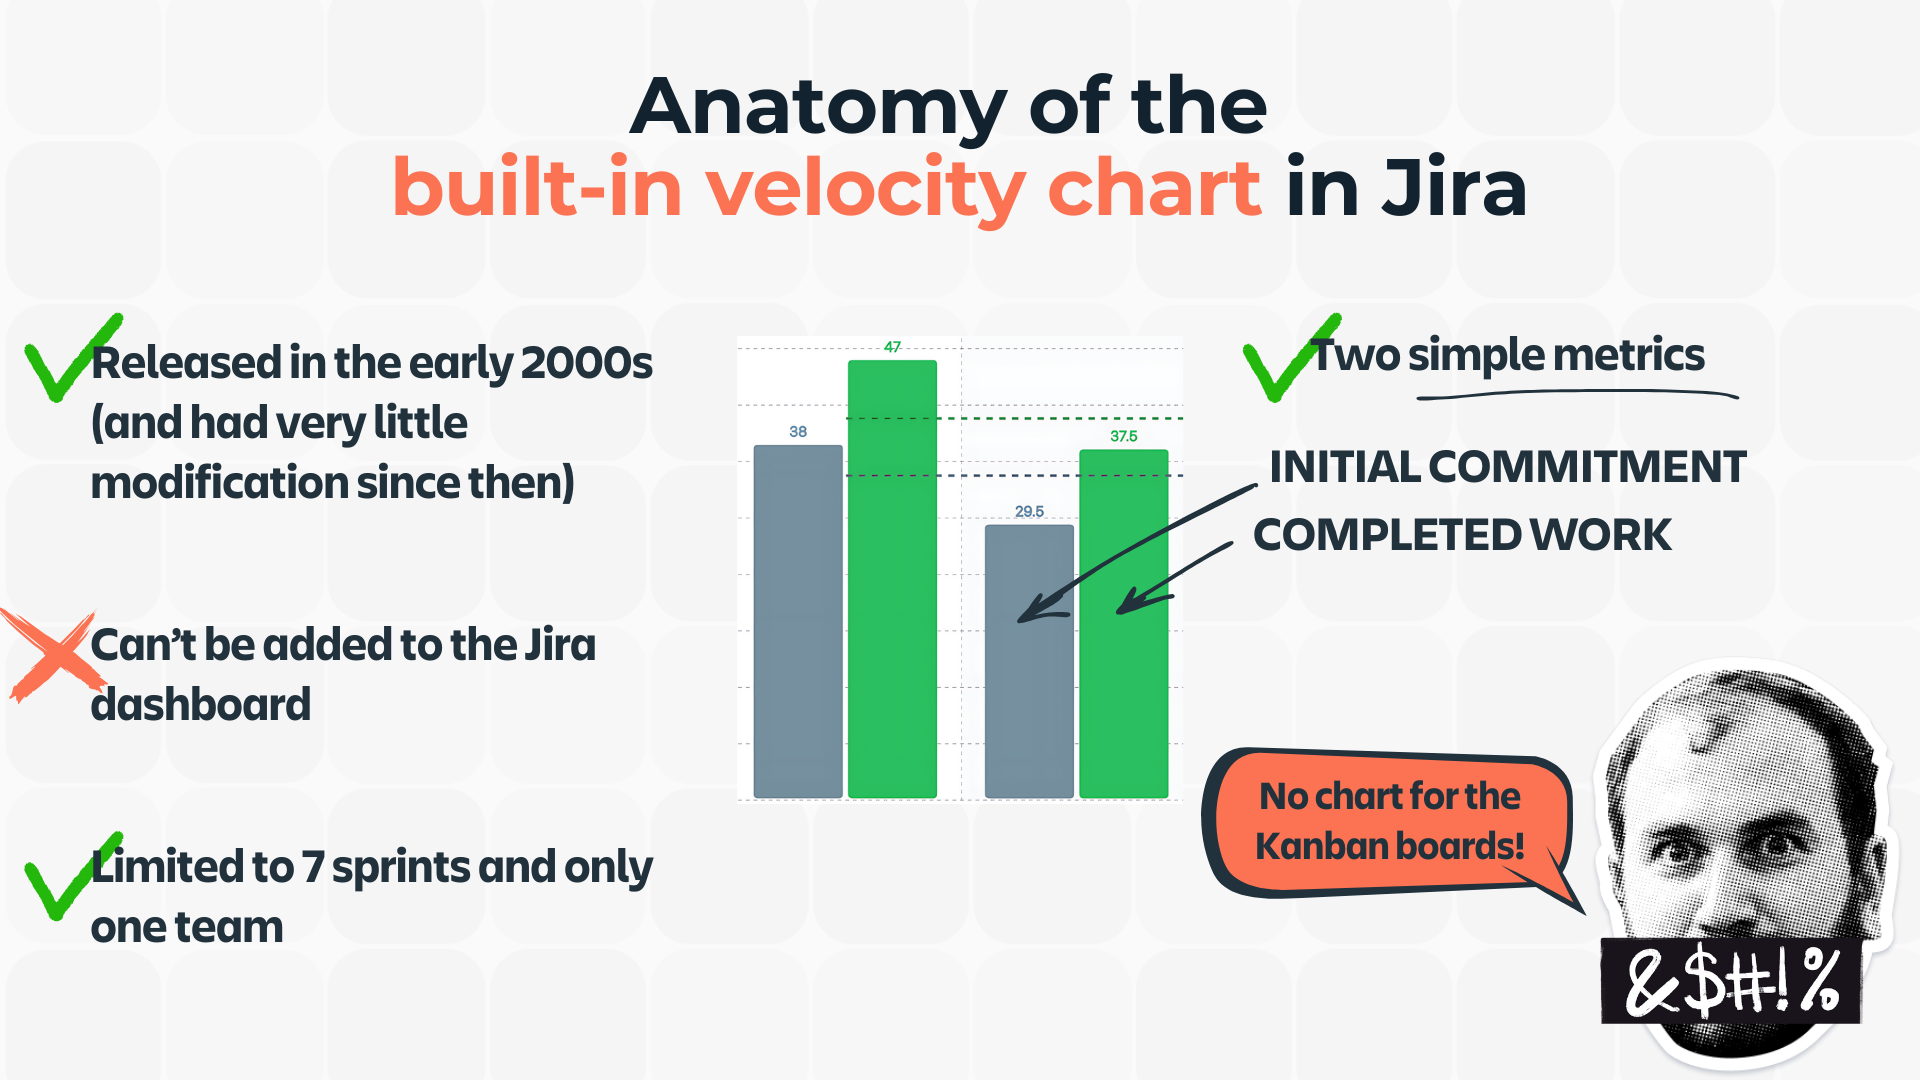
Here's what's good and not so good about it:
✅ The Good:
❌ The Not-So-Good:
-
Can't put it on your Jira dashboard
-
There are only two metrics
-
No way to compare different teams
-
Or analyze several sprints in a row
-
Can't track individual velocity
-
N/a for Kanban teams.
Native Jira tools for Kanban
Jira's standard Kanban boards come with some useful metrics, but they're more focused on flow than velocity:
Available Tools:
-
Cumulative Flow Diagrams (great for spotting bottlenecks)
-
Lead and Cycle Time Reports (how long work takes)
-
Control Charts (variation in delivery time)
Unfortunately, these tools don’t give you the complete picture - a bit like having a car's dashboard without the speedometer.
Not having built-in velocity tracking in Kanban boards means no automatic velocity calculations, no sprint-style velocity charts, and very limited throughput visualization.
So, the teams using Kanban in Jira typically handle this by either manual tracking in spreadsheets or switching to Scrum boards just for metrics. Or using third-party apps for advanced Agile analytics.
Velocity for Scrum and Kanban boards with the Velocity Chart Gadget
Third-party solutions, like the Agile Velocity Chart Gadget, were born out of the limitations of the native Jira tools, so you can do more in that beloved Jira interface.
And just like a new Tesla after a dusty Toyota, the Agile Velocity Chart Gadget takes everything you wish the basic chart could do and makes it happen:
-
Add as many Scrum or Kanban boards as you need as a data source.
-
Include the unlimited number of sprints in the calculation.
-
See how different teams stack up with the Benchmarking chart.
-
Find out who's crushing it on your team with an Individual Velocity chart.
-
Get insights into sprint patterns with Team/Cross-team Velocity charts.
-
Slice and dice data your way with 3-level breakdowns and custom JQL at your service.
-
And if you're running Kanban? The Agile Velocity Chart’s gadget for Kanban boards got you covered.
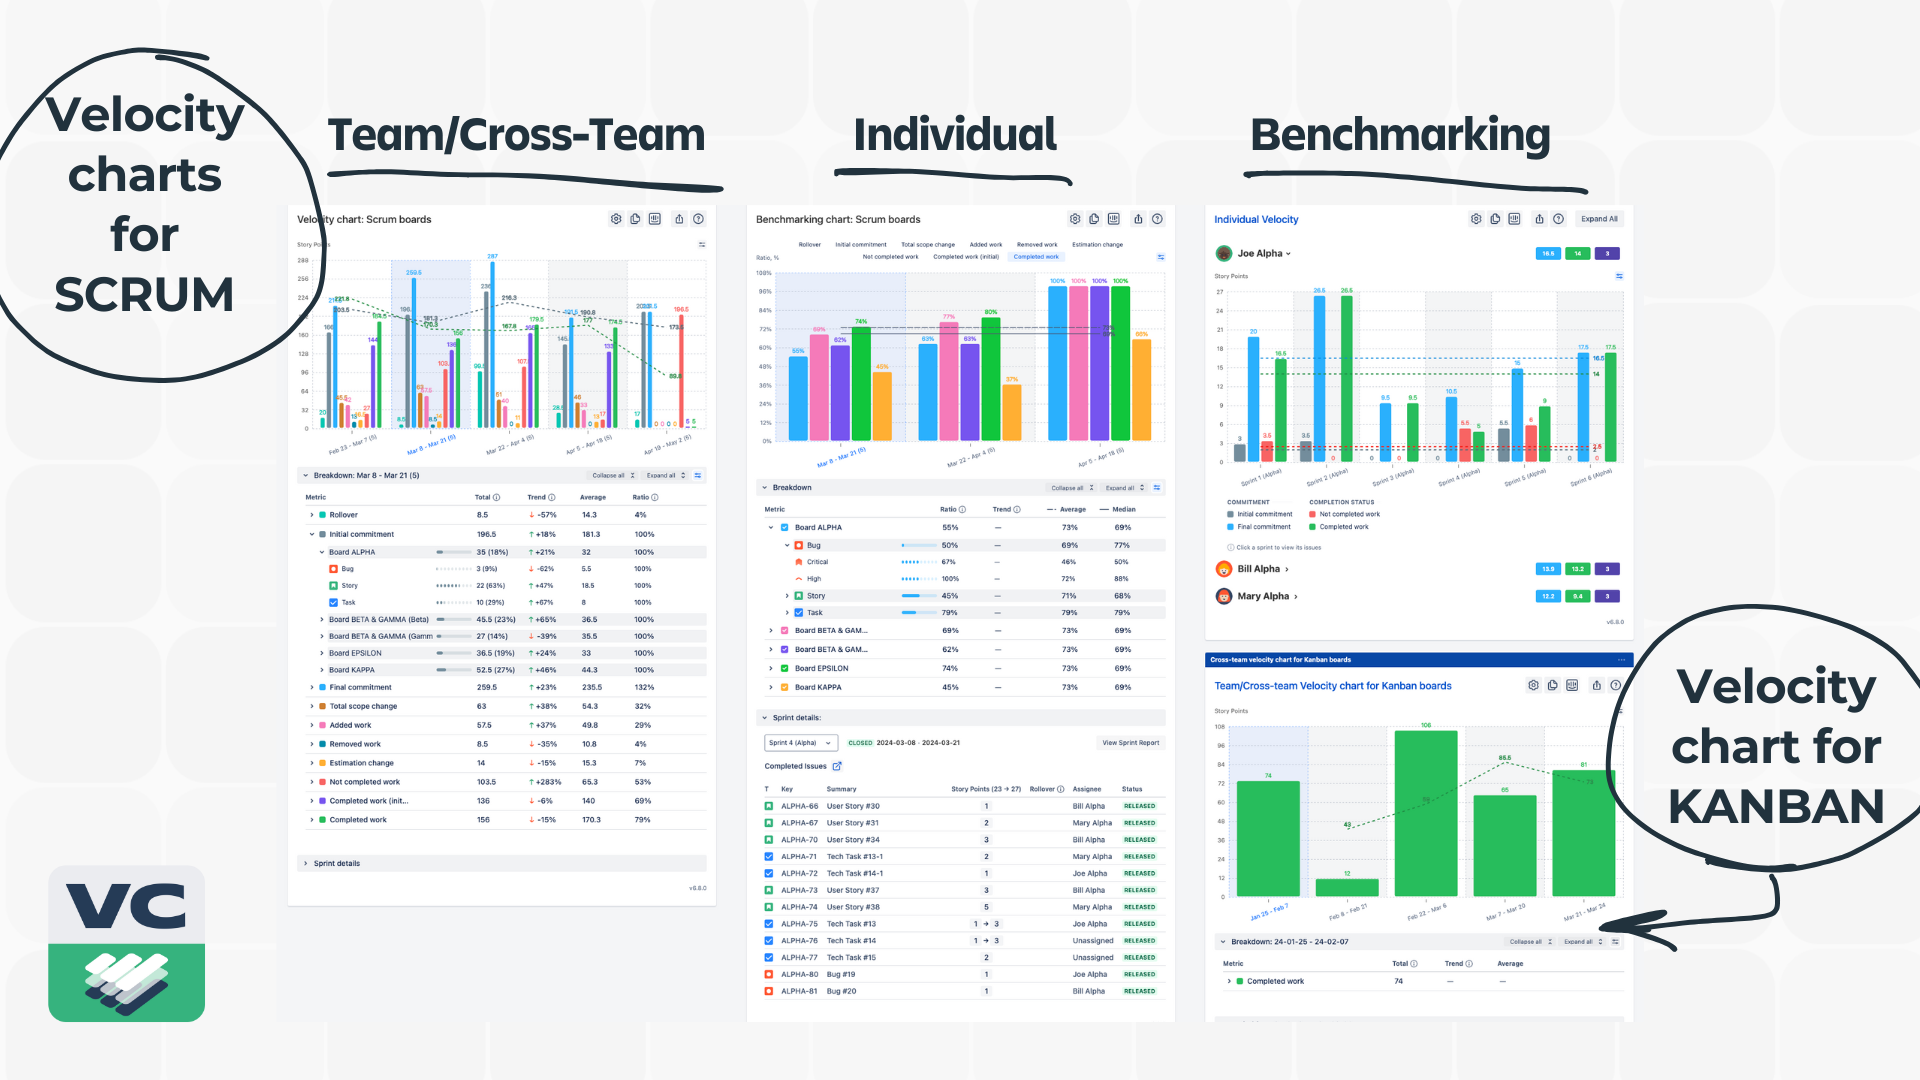
And you have all these charts with important velocity data on your JIRA dashboard, like a mission control center for your teams.
10 sprint metrics of the Agile Velocity Chart
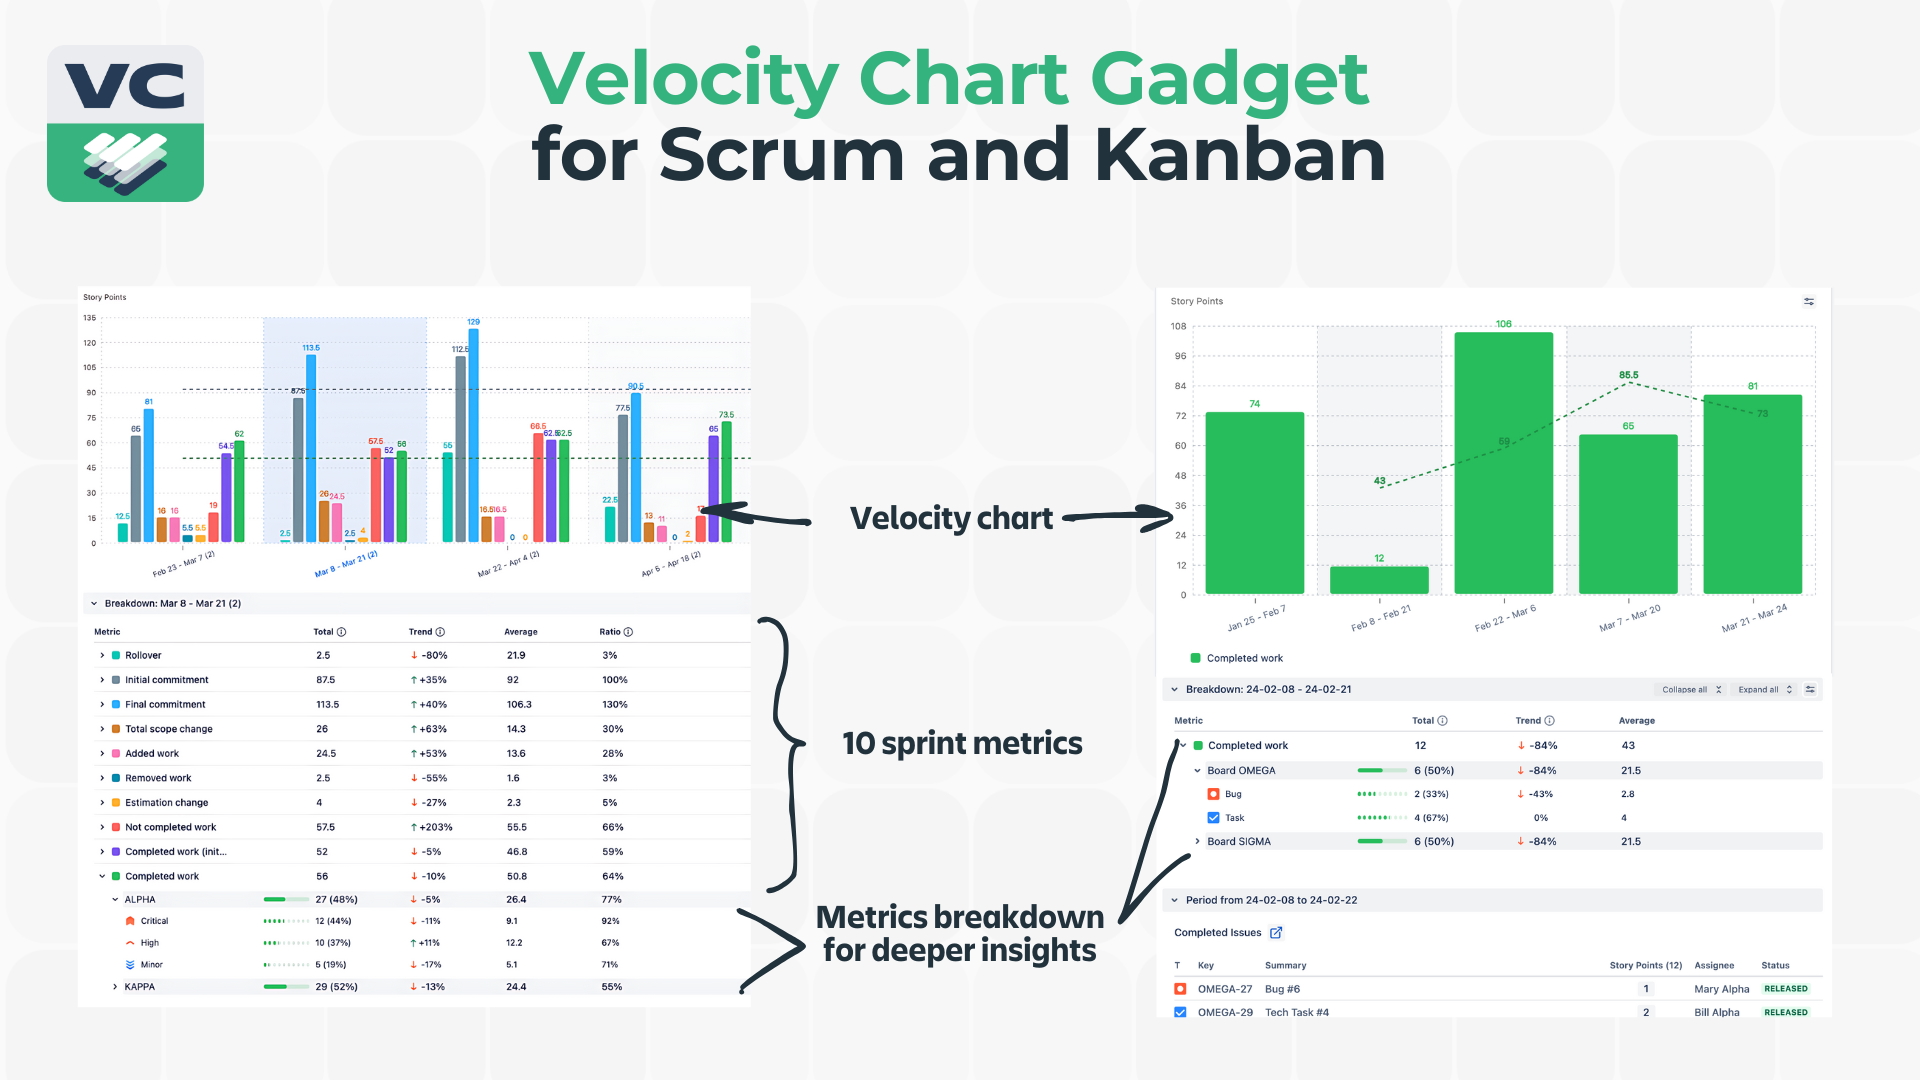
For Scrum teams, the velocity chart offers 10 key metrics that tell the complete story of your sprint:
Core Metrics:
-
Initial Commitment: Where you started
-
Final Commitment: Where you ended up
-
Completed Work: What actually got done
-
Completed Work (Initial): Work completed from initial scope
Scope Changes:
-
Added Work: New items introduced mid-sprint
-
Removed Work: Items taken out
-
Total Scope Change: Net change in sprint scope
-
Estimation Change: Adjustments to story points
Performance Indicators:
Multi-level breakdown analysis
For both Kanban and Scrum boards, the chart's three-level breakdown system offers up to 55 combinations for detailed analysis:
-
Teams and projects
-
Individual contributors
-
Issue types
-
Priorities
-
Labels and components
-
Custom fields, and more.
Some of the most useful combinations are:
Sprint metric (for example, Completed Work) + Board + Issue type = to see how tasks are distributed among multiple teams.
Sprint metric + Release + Issue type = for meaningful insights on the release progress sprint by sprint.
Sprint metric + Priority or Rollover Count = for closer attention to the critical or problematic issues.
Advanced features for better performance insights
Customize your charts with:
-
Time-based grouping (monthly/quarterly)
-
Sub-task tracking
-
Filtering by epics, versions, or custom JQL
Add performance cues:
-
Target lines and moving averages
-
Average, 75th percentile, Median, and 25th percentile benchmarks
Fast and secure data sharing:
Making the velocity chart work for you
Setting up the Agile Velocity Chart is pretty straightforward for both Kanban and Scrum users:
-
Start with the basics in JIRA.
-
Get a free 30-day trial of the Agile Velocity Chart Gadget.
-
Add the Agile Velocity Chart to your dashboard (choose between Individual, Team/Cross-Team, Benchmarking charts for Scrum or the Velocity Chart for Kanban - or take them all for a 360-degree view).
-
Add a board or multiple boards as a data source.
-
Choose sprints or a period of time you want to analyze.
-
Add target lines to have a clear vision of progress.
-
Configure breakdown parameters and their order.
-
Watch the insights roll in.

Once it's set up, you've got a single source of truth for velocity across your whole organization.
No more digging through different tools or trying to piece together the big picture from scattered data.
Give Agile Velocity Chart a go with a 30-day trial (or use it completely free of charge if your team is less than 10 people).

