💡 Introduction
Any organisation relies on a range of metrics to measure the effectiveness of their IT services, one of the most telling being the ticket reopen rate. This article delves into the concept of the ticket reopen rate, why it's crucial, how it’s used, and provides insights with supporting figures to highlight its importance.
" data-emoji-id="2754" data-emoji-text="❔">❔ What is the ticket reopen rate?
The ticket reopen rate is a key performance indicator (KPI) that measures the percentage of tickets that are reopened after they have been marked as resolved or closed. Essentially, it tracks the incidents that were believed to be resolved but required further intervention after the initial closure.
Formula: Ticket Reopen Rate = (Number of Reopened Tickets / Total Resolved Tickets) x 100
For instance, if 200 tickets are closed in a month and 40 of them are reopened, the reopen rate would be 20%.
⁉️ Why is the ticket reopen rate important?
Quality of service
-
A low reopen rate suggests that issues are resolved effectively the first time, which correlates with higher customer satisfaction. According to a 2023 study by MetricNet, organizations with a ticket reopen rate below 5% typically report customer satisfaction scores above 85%.
Cost efficiency
Continuous improvement
-
Monitoring the ticket reopen rate allows organizations to identify areas where service processes can be improved. A high reopen rate can indicate underlying problems in training, resource allocation, or the incident resolution process.
💼 Usage in IT service management
Incident management
Problem Management
-
In ITIL’s problem management process, repeated incidents (indicated by ticket reopenings) can signal an underlying problem. By analyzing these trends, organizations can take proactive steps to address the root causes, thereby reducing future incidents.
Change Management
🌟 Best practices for managing the ticket reopen rate
Root cause analysis
Effective knowledge management
Training and development
Customer feedback loop
🛠️ How to measure the ticket reopen rate
The Closed vs. Reopened Report in Report Builder is a valuable tool for measuring the ticket reopen rate within IT service management (ITSM). This report provides insights into the effectiveness of incident resolution by comparing the number of closed tickets to the number of reopened ones, allowing organizations to monitor and analyze the quality of their service processes.
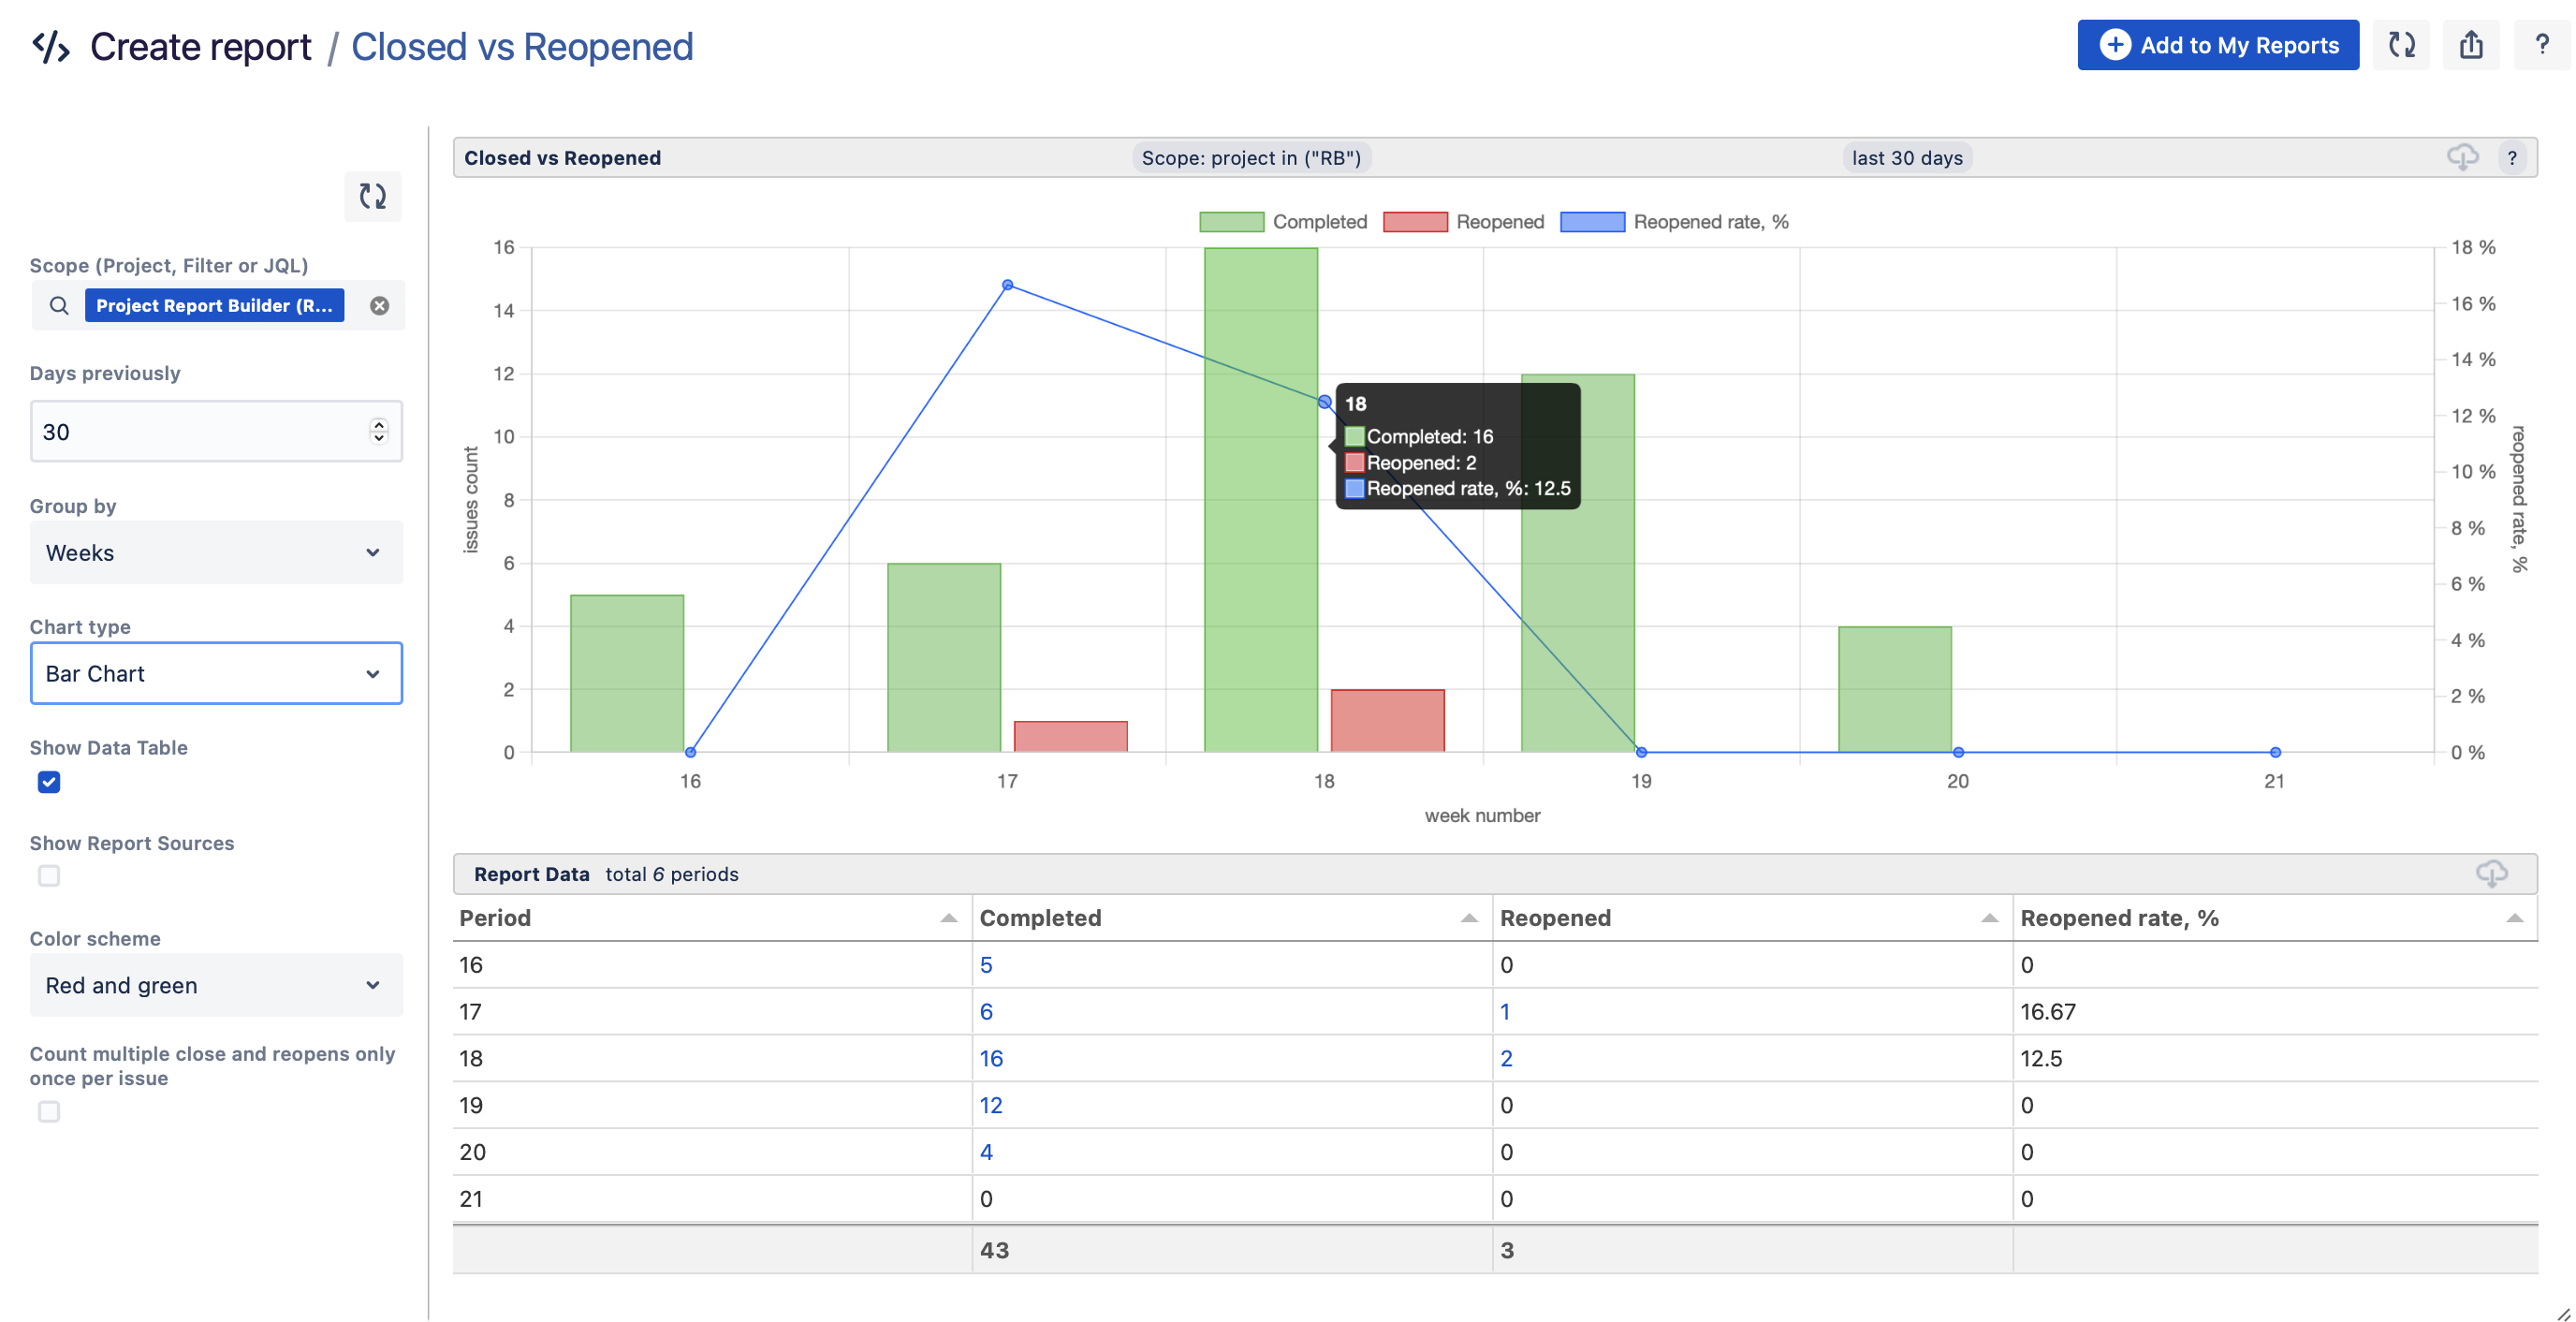
💪🏻 How the report helps to measure the ticket reopen rate:
Reopen rate calculation
Trend analysis
-
The report allows you to visualize trends over time by grouping data by days, weeks, or months. This helps in identifying patterns, such as an increase in reopened tickets during a specific period, which might indicate underlying issues with recent changes or processes.
Detailed breakdown
Customization and export options
-
You can customize the report based on specific projects, epics, or issues, and export the findings in various formats such as PDF or CSV. This flexibility makes it easier to incorporate the findings into broader reporting or analysis tools.
Granular control
🎆 Conclusion
The ticket reopen rate is a critical metric that provides insight into the effectiveness of an organization's IT service delivery. A high reopen rate can point to unresolved issues, inefficiencies, or communication gaps. Start analyzing your reopen rate regularly and implement best practices to ensure your services are both efficient and effective.
Ready to take action? The Closed vs. Reopened Report in Report Builder provides the insights you need to turn data into improvement.
Find Report Builder on the Atlassian Marketplace or book a free demo.
