Hiya,
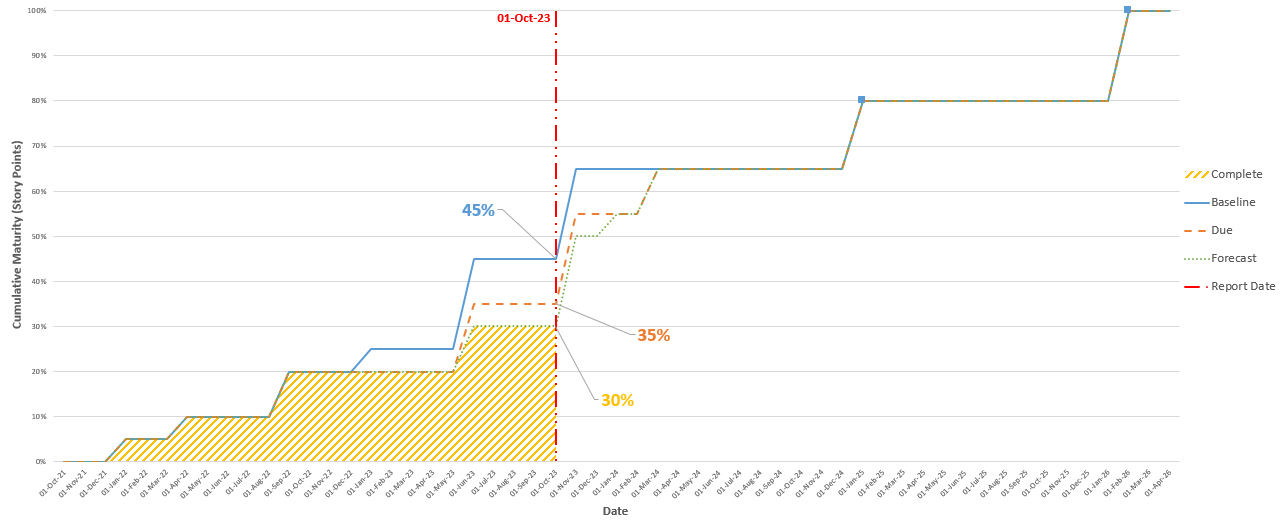
I would like to do something like the following graph in Eazybi using fields from Jira. Does anyone know if its possible? Currently running in Excel and updating manually.
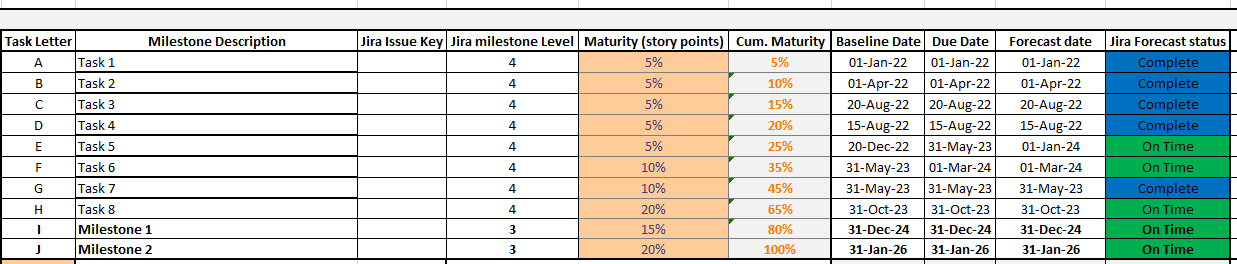
See table for the Raw data its using which are all field in Jira some of which are custom.
Any help on how to get started on some examples would be greatly appreciated.
Cant seem to find many examples where the forecast line is not straight and in fact uses the forecast dates inputted to show how far under or above the baseline you are.
Thanks


