Hi community,
I'm using Jira software Datacenter instance version 9.4.8.
I would like to have an overview of my work in the next weeks to check the current work that needs to get done and the weight of this work. For this, I use story point to describe the weight of a task. I split it in different weeks depending on the time I have to do the task.
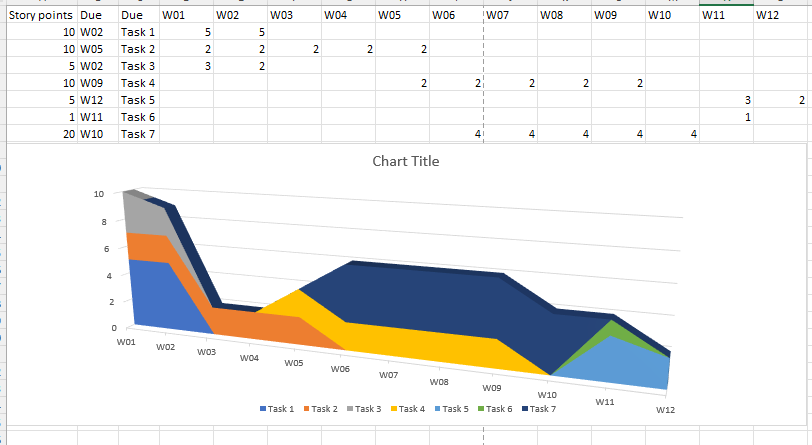
For now, I'm doing the check in Excel with the following way:
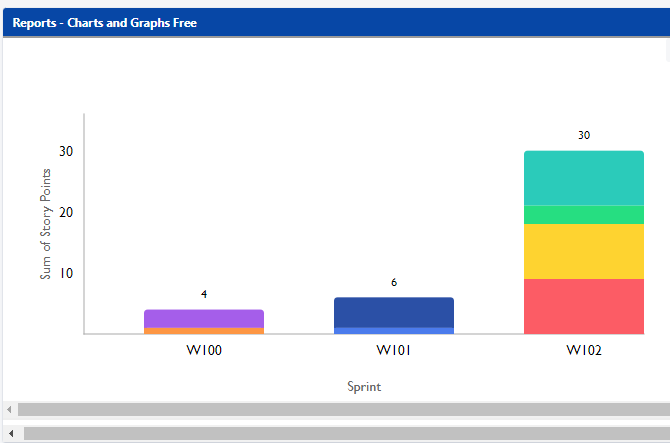
I have tested to display it with KPIs & "Reports - Charts and Graphs Free" add-on (x-axis as a sprint & ticket summary, y-axis as sum of story points), but as I can't attribute story points to different weeks, I cannot reproduce it.
Any idea how to recreate this first graph in Jira ?
Am I misunderstanding the use of story points in Scrum methodology?
Thank you for your help,

