Hi, i have a table and chart produced like this below.
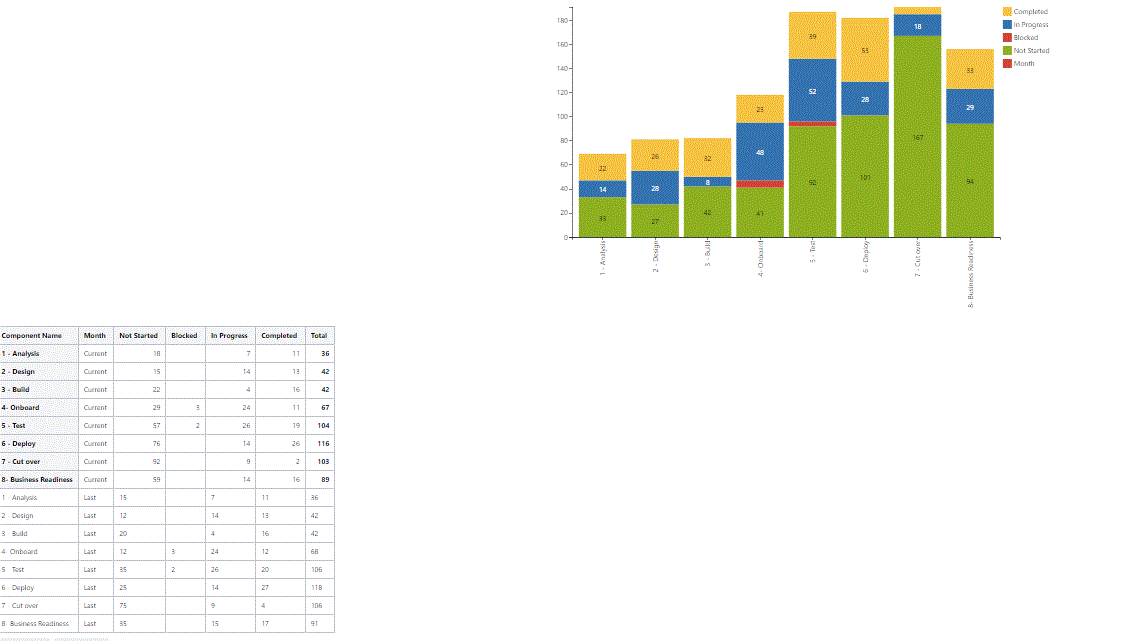
Currently its showing one column for one component. Instead i need a graph with 2 columns for each component showing the current and past month values. i am using the stacked bar graph. i need something like a grouped stacked bar. Is it possible please? thanks.


