Hello allmighty Experts,
I have a problem!
I need to a plot showing that Value is in Spec for each Set.
| Character | Set | Value | Spec Max | Spec Min |
|---|
| A | 1 | 0.6 | 1 | -1 |
| B | 2 | -0.2 | 1 | -1 |
| C | 3 | 1.5 | 1 | -1 |
| D | 4 | -0.3 | 1 | -1 |
Spec is always the same, so should show up as a horizontal line.
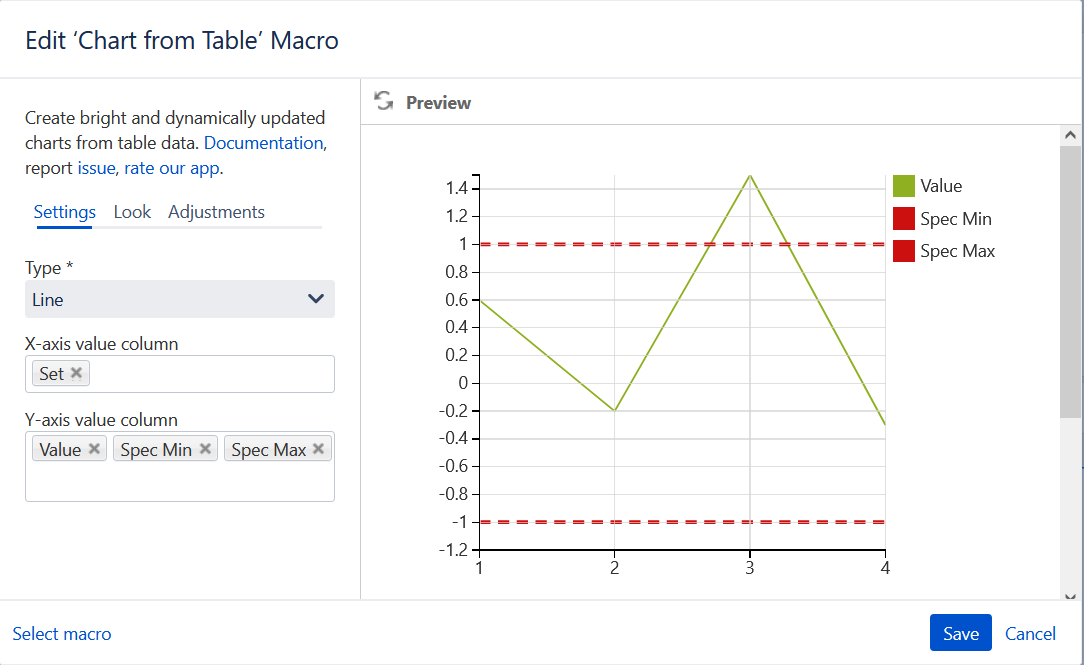
However, when I have two rows corresponding to the same Set my Spec line is broken.
| Character | Set | Value | Spec Max | Spec Min |
|---|
| A | 1 | 0.6 | 1 | -1 |
| B | 2 | -0.2 | 1 | -1 |
| C | 2 | 1.5 | 1 | -1 |
| D | 3 | -0.3 | 1 | -1 |
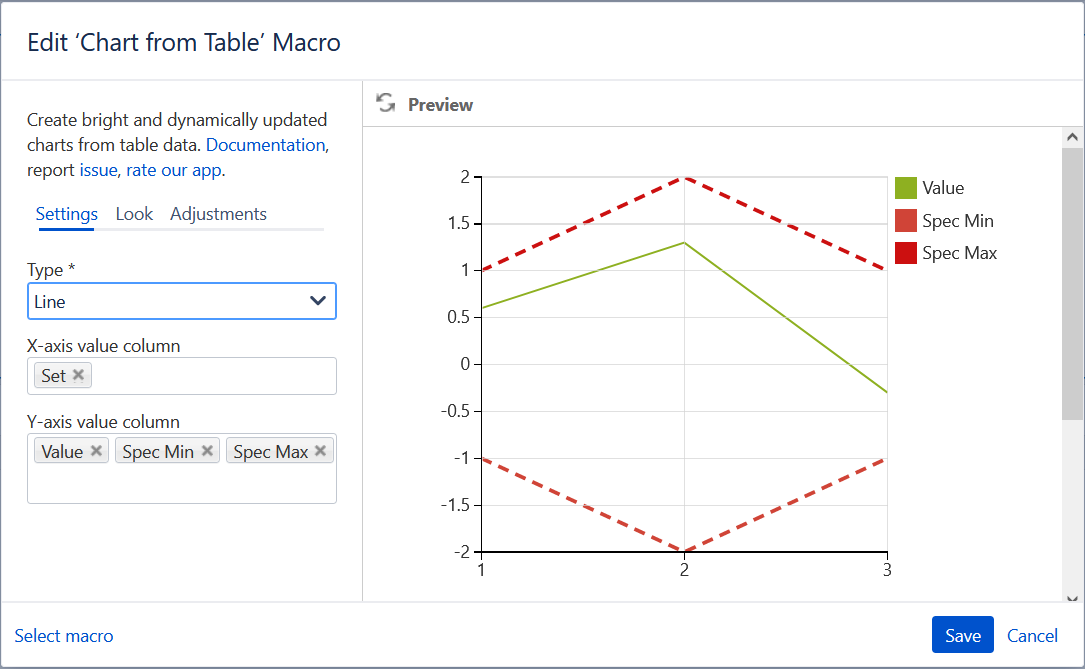
Anyone has an idea how I could solve this? I often have multiple values corresponding to the same set.
Cheers
Kai


