I have a Confluence page used as a dashboard that pulls multiple pages across multiple spaces to summarize sprint delivery metrics. The dashboard uses a series of macros including Table Transformer, and the individual sprint pages also have a series of macros including Table Filter.
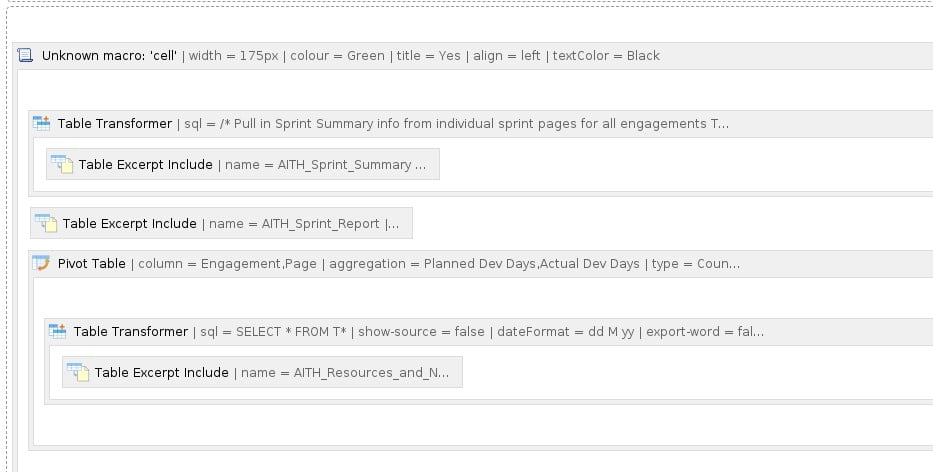
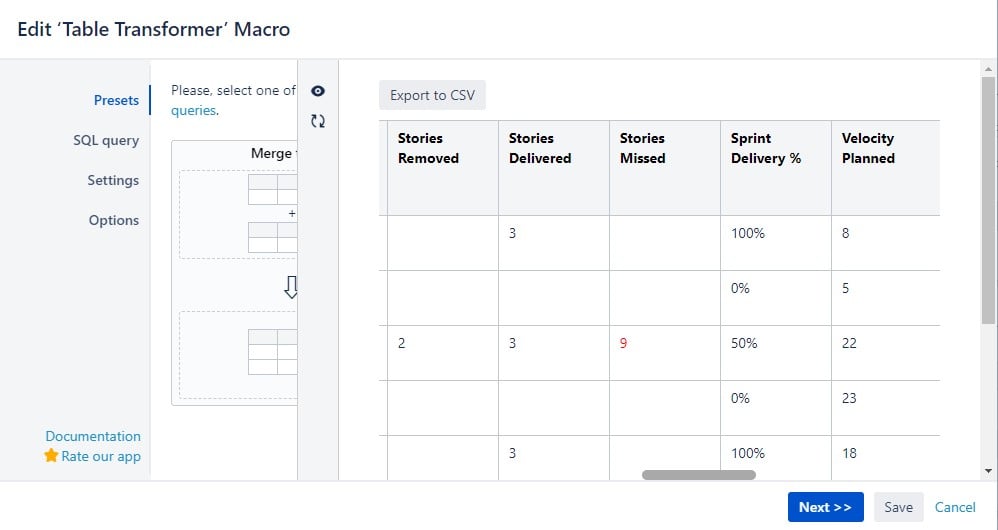
In the dashboard, when in Edit mode, if I open the top-most macro (Table Transformer) and preview the results, they appear correctly.
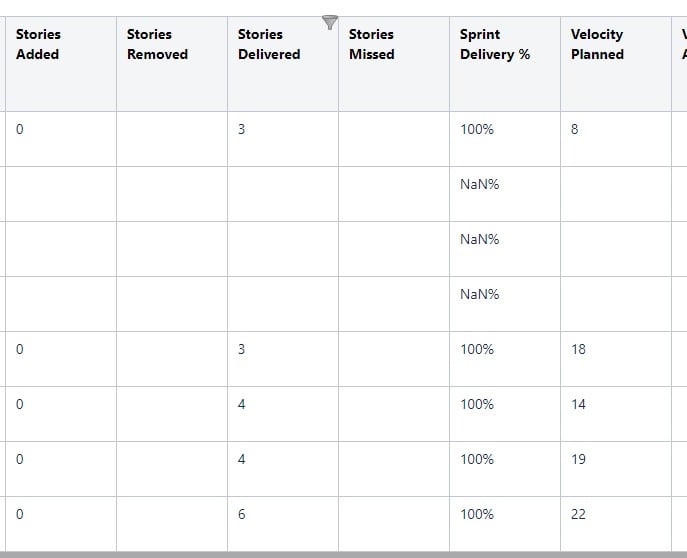
However, when in View mode, some of the data disappears and the calculated "Sprint Delivery %" shows as NaN%.
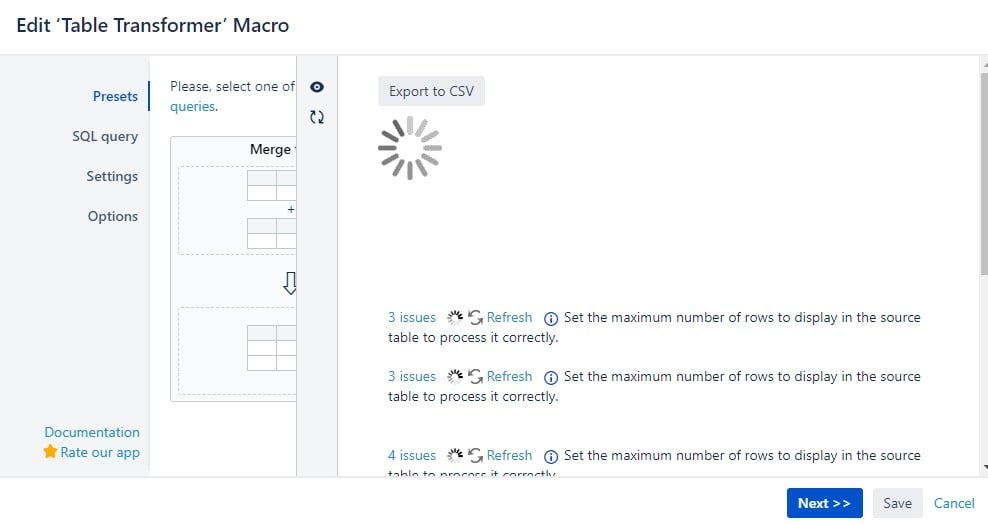
What could be causing this to happen? One thing that may be at work is that during the Table Transformer preview, or when updating the Page to View mode, I see these messages below ("Set the maximum number of rows to display..."), but they go away when the data is displayed, and at least in the Transformer preview, the data ends up appearing correctly.
Do those messages refer to the "Number of rows per page" setting in Table Filter. If so, those macros are all in the individual sprint pages, but that setting was left blank. I even set a value of 100 for my test pages, but that didn't change the behavior described above.
In any case, please advise, as I'm at my wits end trying to understand the source of this problem. All the individual sprint pages have the same set of macros, when tested individually, they all work. Only when I'm trying to consolidate multiple pages do I get this result.

